Figure 1.
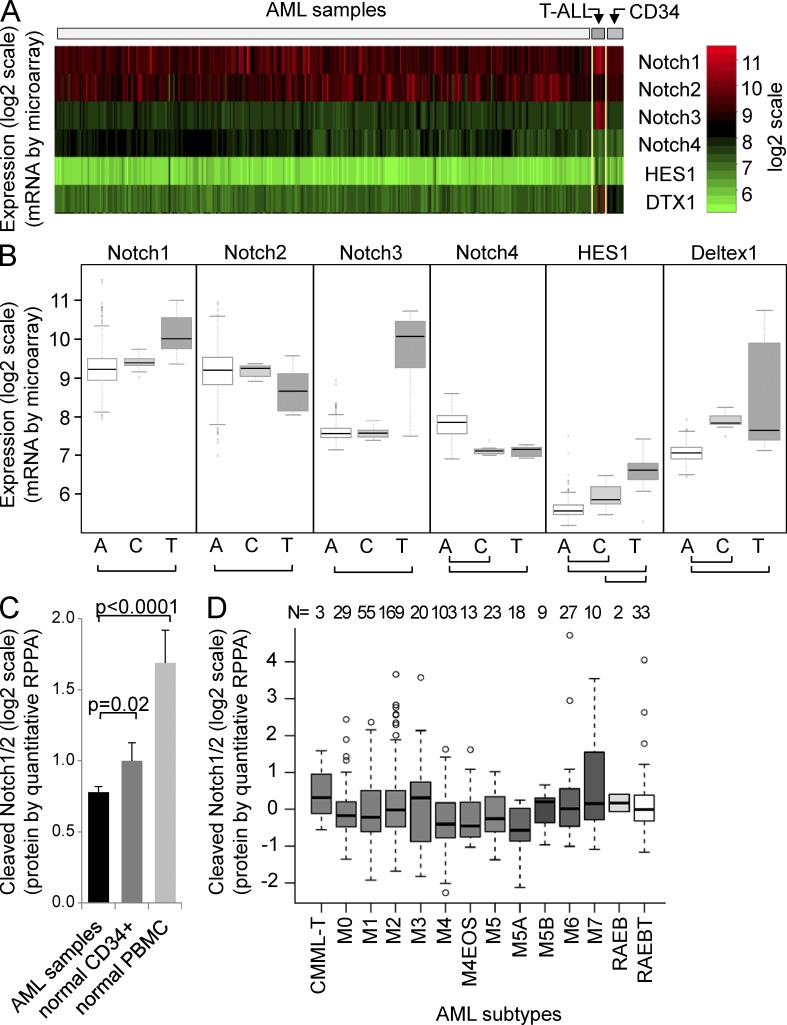
Notch pathway expression in human AML patient samples. (A) Heatmap for Notch1–4, HES1, and Deltex1 (DTX1) from Affymetrix HG-U133 Plus 2 microarray data from 344 AML patient samples, 11 normal CD34-selected controls, and 8 T-ALL patient samples, normalized and shown as log2 scale (red, high; green, low). (B) Box plots from data in A. A, AML patient samples; C, CD34-selected controls; T, T-ALL patient samples. Student’s t tests reveal significant differences between AML and T-ALL samples in all four Notch receptors and two target genes (HES1 and Deltex1); bars indicate P < 0.001. A single dataset was analyzed. (C) Column chart showing cleaved Notch1/2 receptor antibody (Val1744; Cell Signaling Technology) data from a validated reverse phase protein lysate array (RPPA) with quantitative dilutions of 560 AML patient samples, 10 normal CD34-selected controls, and 21 normal peripheral blood mononuclear cell controls (mean ± SD). (D) Box plots from RPPA in C showing average and SD for FAB subtypes. Single dataset analyzed.

