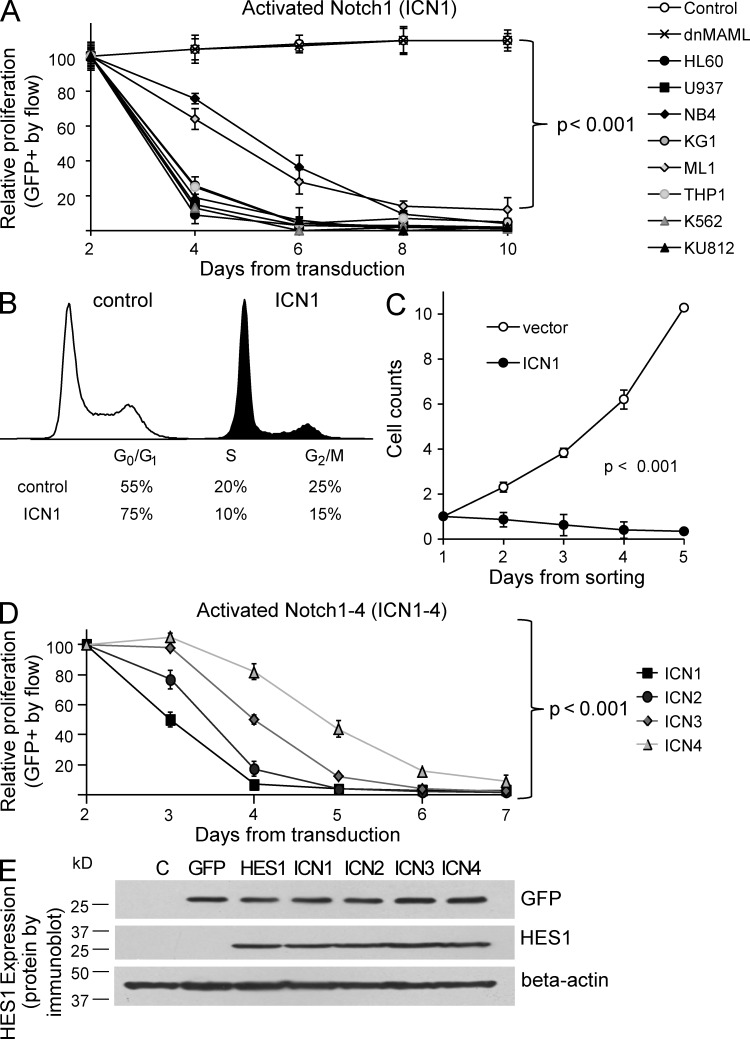
Figure 3.
Activated Notch1–4 induce growth arrest and increase HES1 expression in AML cell lines. (A) Flow cytometry data showing changes in GFP when eight AML lines are transduced with retroviral vectors expressing either activated ICN1, the Notch inhibitor dnMAML, or GFP-only control (mean ± SD). Because of differences in transduction efficiency, all experiments were normalized to day 2 levels. Triplicate samples were analyzed. (B) Flow cytometry–based cell cycle analysis via the DNA dye DRAQ5 in U937 AML cells. DNA content of GFP+ (ICN1-transduced) cells are compared to GFP− (untransduced) cells 48 hours after transduction. FlowJo software was used to estimate the percentage of cells in the G0/G1, S, and G2/M phases of the cell cycle. Triplicate samples were analyzed, and similar results were obtained in K562 and HL60 lines. (C) Cell counts measured by hemocytometer. Results from replicate experiments with U937 cells were combined and normalized to day 1. ANOVA reveals significant differences across time points (P < 0.001). Triplicate samples analyzed and similar results were obtained in K562 and HL60 lines. (D) Flow cytometry data showing changes in GFP when U937 cells are transduced with constitutively active forms of Notch1–4, i.e., ICN1–4 (mean ± SD). Triplicate samples analyzed and similar results were obtained in K562 line. (E) Immunoblot of U937 AML cells transduced with GFP, HES1, and ICN1–4, and then probed for GFP, HES1, and β-actin. Representative of two blots.

