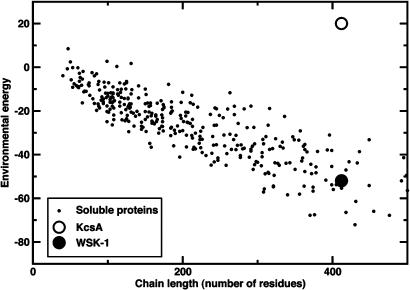
Fig. 1.
Eenv (16) vs. chain length. Eenv quantifies solvation and hydrophobic effects and has been parameterized by using a database of 500 soluble proteins (small circles) (16). For each protein structure, Eenv=∑i ε(ai, ra,i, ρCβ) where for the ith residue ai, ra,i, and ρCβ are the amino acid, side chain conformation, and local density of β carbons. Also shown is the Eenv for WT KcsA (open circle) and the value Eenv that was used as a constraint in the sequence calculations (black circle).

