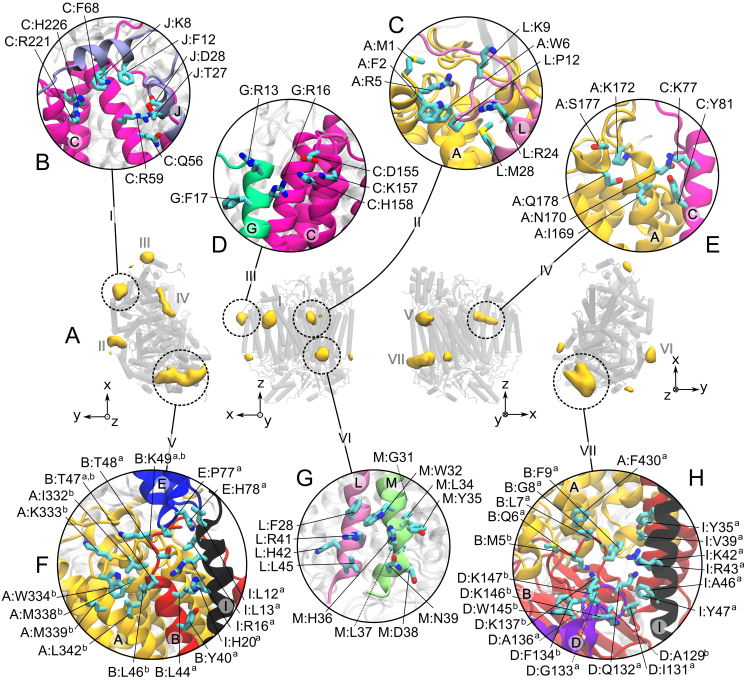
Figure 2. Cardiolipin (CL) binding sites on cytochrome c oxidase (CIV).
Binding sites are extracted from a 100 μs of CGMD simulation of the complex embedded in a CL/POPC membrane bilayer. (A) From left to right: matrix, membrane (two orientations) and inter membrane space (IMS) views of CIV with the CL densities shown in yellow volume maps at an isovalue corresponding to at least 5 times the bulk density. The protein is shown as shaded grey cylinders with the CL densities projected onto them. (B–H) Detailed description of the CL binding sites I to VII, respectively. The residues are numbered as follows: “chain:residuesub-site”. For each site, the subunits involved in the interactions with the CLs are depicted as colored cartoon as in Fig. 1. The rest of the protein is shown in a transparent gray cartoon.

