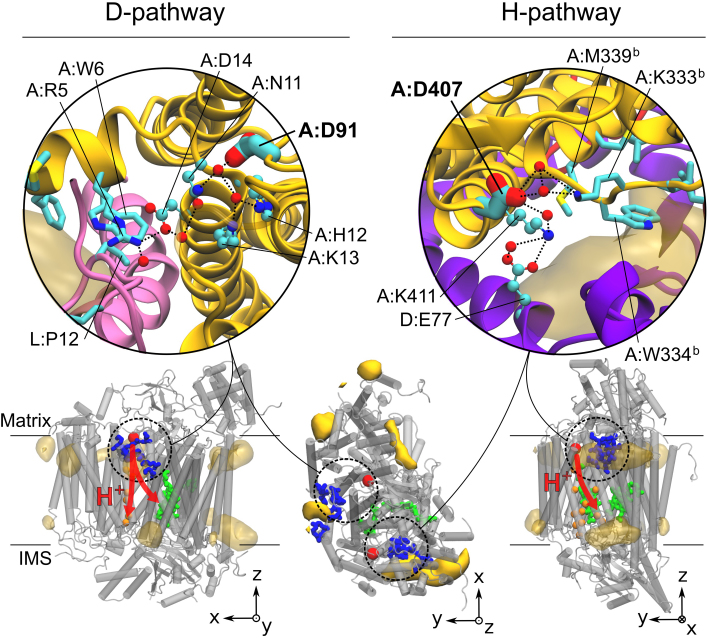
Figure 6. H-bond networks leading from the cardiolipin (CL) binding sites to the entrance of D- and H-pathways, A:D91 and A:D407, respectively.
The CL binding sites are shown in stick representation. The yellow surface maps depict the CL densities shown in Fig. 2. A:D91 and A:D407 are shown in large sticks. The residues and water molecules (red spheres) participating to the networks are shown in a ball-and-stick representation and numbered as in Fig. 2. The bottom row shows side and top views of CIV with the CL densities, the residues involved in the sites in blue, the residues involved in the transmembrane section of the proton pathways (red arrows) in orange spheres and the heme molecules in green. The large red spheres position the entrances (A:D91 and A:D407) of the pathways.

