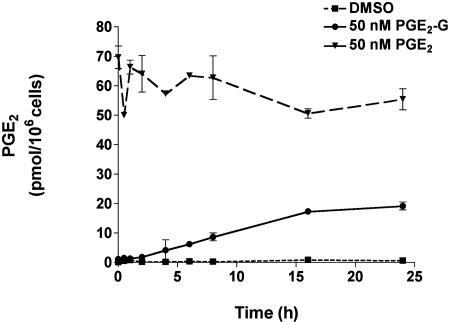
Fig. 3.
PGE2-G is not converted to PGE2 in cultures of RAW264.7 cells. RAW264.7 cells were treated with DMSO (dashed line), 50 nM PGE2-G (solid line), or 50 nM PGE2 (broken line). Medium was withdrawn at different time points, and PGE2 in the medium was quantified by GC/MS as described (5). Values obtained with vehicle control represented basal PGE2 levels. Sample treatments from a single experiment performed in triplicate are plotted as pmol of PGE2 per 106 cells vs. time. Error bars represent standard deviation in samples from a single experiment performed in triplicate. The experiment was performed twice with similar results.

