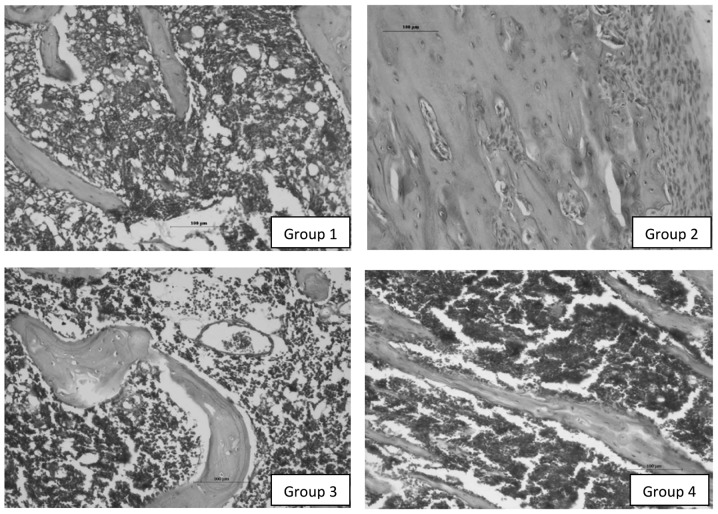
Figure 1.
Photomicrographs of tissue sections (×200 magnification, H&E stained). (Group 1) Healthy cortical bone, haemopoietic cells and fat cells. (Group 2) Areas of sclerosis and areas of fibrosis. (Group 3) Prominent blood vessel and areas of mild hyperplasia of haemopoietic cells. (Group 4) Hyperplasia of haemopoietic cells surrounded by healthy cortical bone. Group 1, control; group 2, lead alone; group 3, Carica papaya alone (50 mg/kg); group 4, Carica papaya alone (200 mg/kg); H&E, haematoxylin and eosin.

