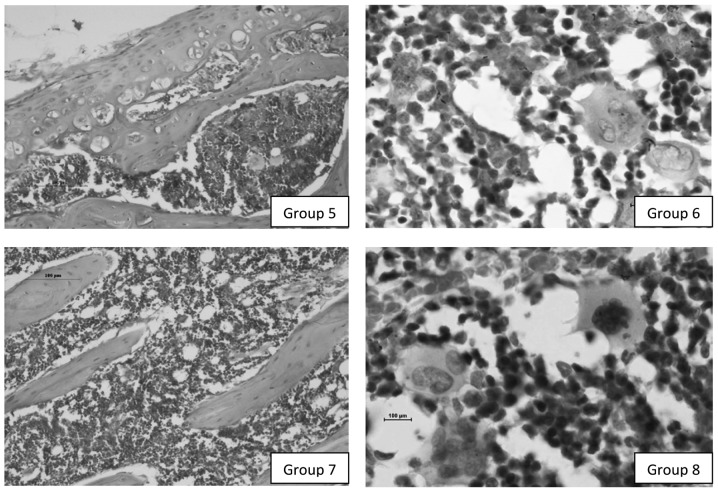
Figure 2.
Photomicrograph of tissue sections (H&E stained). (Group 5) Proliferation of cells beginning from the metaphysis of the bone marrow and hyperplasia of the haemopoietic cells (×200 magnification). (Group 6) Increase in megakaryocytes and myeloblast cells. Erythroid precursors may also be observed (×1000 magnification). (Group 7) Increased blood vessel proliferation, hyperplasia of the cells and a healthy cortical bone (x200 magnification). (Group 8) Increase in megakaryocytes and eosinophils as well as myeloblast precursors. Reticulocytes may also be observed (×1000 magnification). Group 5, lead and post-treatment with Carica papaya (50 mg/kg); Group 6, lead and post-treatment with Carica papaya (200 mg/kg); Group 7, pre-treatment with Carica papaya (50 mg/kg) followed by lead; Group 8, pre-treatment with Carica papaya (200 mg/kg) followed by lead; H&E, haematoxylin and eosin.

