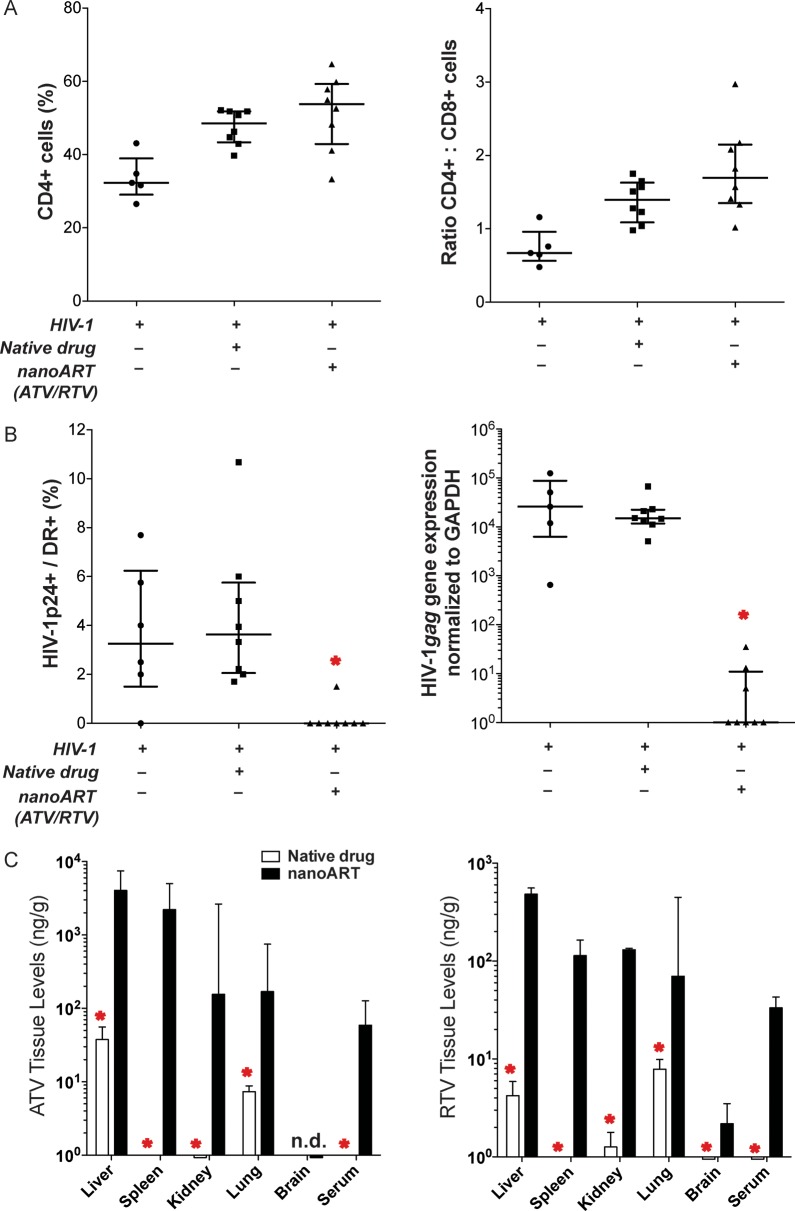
Figure 5.
Antiretroviral activities of nanoformulated antiretroviral therapy (nanoART) administered prior to human immunodeficiency virus type 1 (HIV-1) exposure. NanoART was delivered on day 0 as a combination of atazanavir (ATV) and ritonavir (RTV) (250 mg/kg each H3001 and H2001, subcutaneously) to peripheral blood lymphocyte (PBL)–reconstituted NSG mice. Native drugs (250 mg/kg each ATV and RTV in PBS) were delivered by oral gavage on day 0. Mice were infected with HIV-1ADA on day 1. Spleens were harvested on day 9 after drug injection. A, Fluorescence-activated cell sorting analysis shows the percentage of human CD4+ among total CD3+ T cells (left panel) and CD4+/CD8+ T-cell ratios (right panel) for spleens from individual mice. B, Percentages of HIV-1p24–expressing cells among human HLA-DR+ cells were determined from cell counts of immunohistochemistry from splenic tissues (left panel). HIV-1gag RNA expression normalized to glyceraldehyde-3-phosphate dehydrogenase (GAPDH) messenger RNA expression in spleen (right panel). A and B, Data are shown as individual data points and median ± 25th and 75th percentiles (bar ± whisker) for 5–8 mice per group, analysis of variance of rank-transformed values, and significant differences determined by Tukey post hoc analyses, whereby P < .01 compared to native drug–treated, PBL-reconstituted, HIV-1–infected mice. C, Tissue and serum drug levels of ATV (left panel) and RTV (right panel) on day 9 following subcutaneous injection of nanoART or native drugs to mice. Data are expressed as median ± 25th (serum) and 75th (serum and tissue) percentiles for 8 mice per group, analyzed by Mann-Whitney test and significant differences determined by Tukey post hoc analyses. *Significantly different from nanoART-treated, PBL-reconstituted, HIV-1–infected NSG mice at P ≤ .01.

