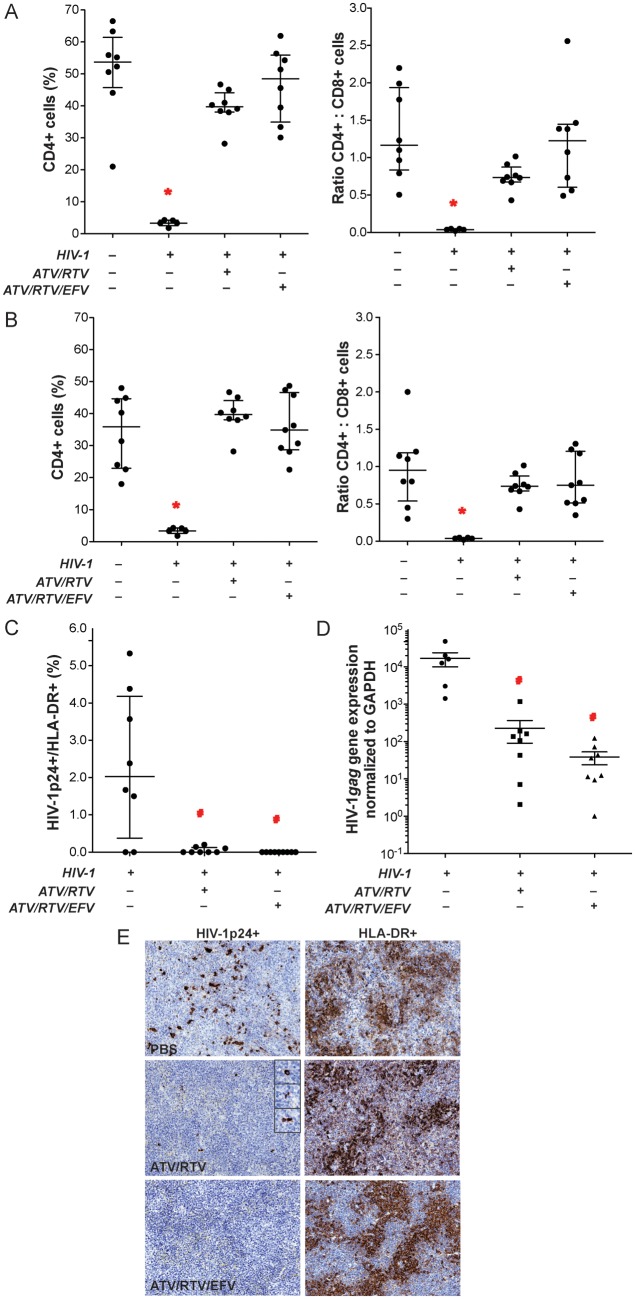
Figure 6.
Antiretroviral activities of nanoformulated antiretroviral therapy (nanoART). NanoART was delivered on days 0 and 7 as a combination of atazanavir (ATV) and ritonavir (RTV) (250 mg/kg each H3001 and H2001, subcutaneously) or a combination of ATV, RTV, and efavirenz (EFV) (100 mg/kg each H3001, H2001, and H4001, subcutaneously) to peripheral blood lymphocyte (PBL)–NSG mice infected intraperitoneally with human immunodeficiency virus type 1 (HIV-1)ADA 12 h before initial nanoART dose. Peripheral blood and spleens were collected on day 14 after initial nanoART injection. Fluorescence-activated cell sorting analyses show the percentage of human CD4+ among total CD3+ T cells (left panels) and CD4+/CD8+ T-cell ratios (right panels) for peripheral blood (A) and spleen (B) from individual mice. C, Percentages of HIV-1p24–expressing cells among human HLA-DR+ cells were determined from cell counts of immunostained serial sections through spleens of PBL-reconstituted, HIV-1ADA–infected PBL-NSG mice. D, HIV-1gag RNA expression in spleen normalized to glyceraldehyde-3-phosphate dehydrogenase (GAPDH) messenger RNA expression. E, Expression of human HLA-DR and HIV-1p24 in alternate serial sections of splenic tissues from HIV-1–infected NSG mice treated with PBS vehicle (top panels), ATV and RTV (middle panels), or ATV, RTV, and EFV (bottom panels). Spleens were collected on day 14 after initial nanoART injection, sectioned, immunostained with antibodies specific for HLA-DR or HIV-1p24, followed by secondary antibodies conjugated with horseradish peroxidase, and were visualized by 3,3-diaminobenzidine . A–D, Data are shown as individual data points and median ± 25th and 75th percentiles (bar ± whisker) for 3–8 mice per group, analyzed by analysis of variance of rank-transformed values and significant differences determined by Tukey post hoc analysis, whereby P ≤ .05 compared to (*) nontreated, nonreconstituted, noninfected NSG mice and (#) nontreated, HIV-1–infected PBL-NSG mice.

