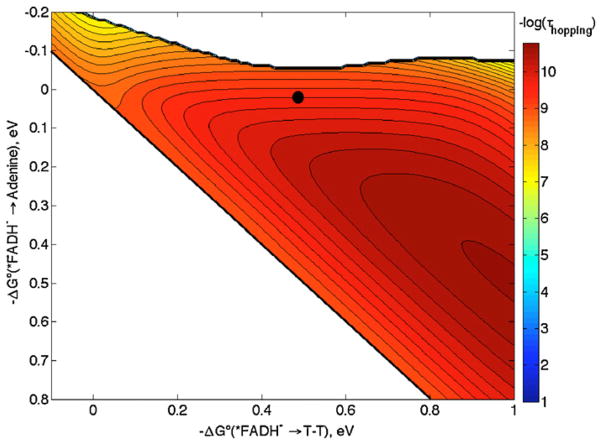
Fig. 9.
Hopping map for DNA photolyase. λ = 0.5 eV (all other ET parameters are the same as in Fig. 8). The contour lines are plotted at 0.2 log unit intervals of τhopping. The black dot represents the predicted time constant with −ΔG°DI = 0 eV and −ΔG°DA = 0.5 eV (see text).

