
Fig. 4.
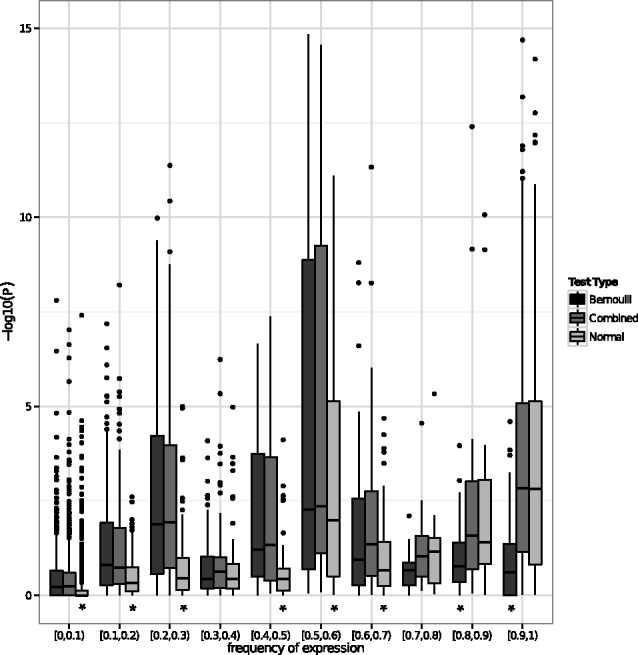
 of tests (genes
  units) versus frequencies of expression
  of the genes. The Bernoulli, normal-theory and combined LRTs are plotted. Asterisk indicates test is different from the combined test at 5% significance in a Wilcoxon signed-rank test