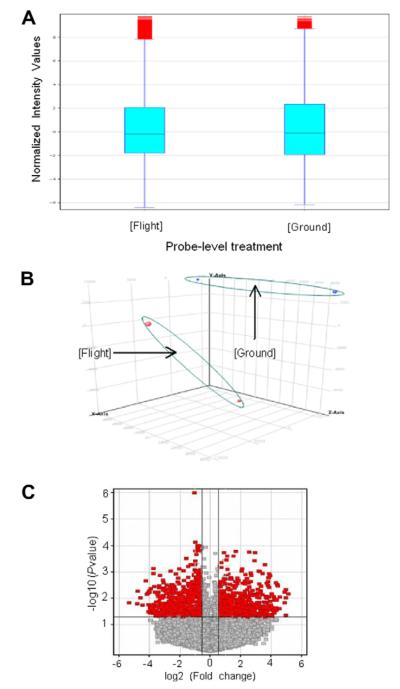
Fig. 2.
Analyses of data from microarray. (A) The box plot of gene expression Flight and Ground control groups. (B) Principal component analysis of Flight and Ground treatments. (C) Volcano plot of Flight sample transcript levels that are significantly different from Ground control samples. Dark dots represent genes that have >1.5 fold-change (x-axis) as well as high statistical significance cut off with a p-value < 0.05 (y-axis). The gray dots represent genes that are not significantly different.

