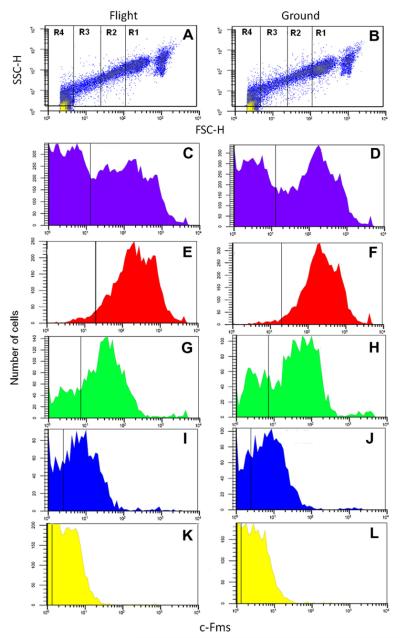
Fig. 3.
Flow cytometric analysis of Flight (left column) and Ground control (right column) samples. (A and B) Representative plots of forward vs. side scatter to establish Regions 1–4 for further analysis. Histograms of total cells (C and D), Region 1 (E and F), Region 2 (G and H), Region 3 (I and J), Region 4 (K and L) for c-Fms expression.

