Figure 12.
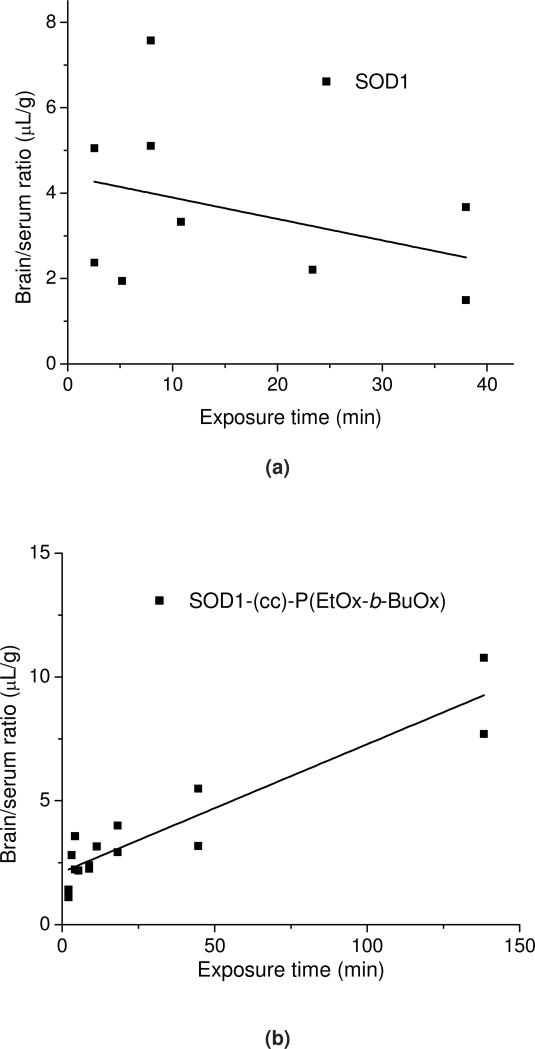
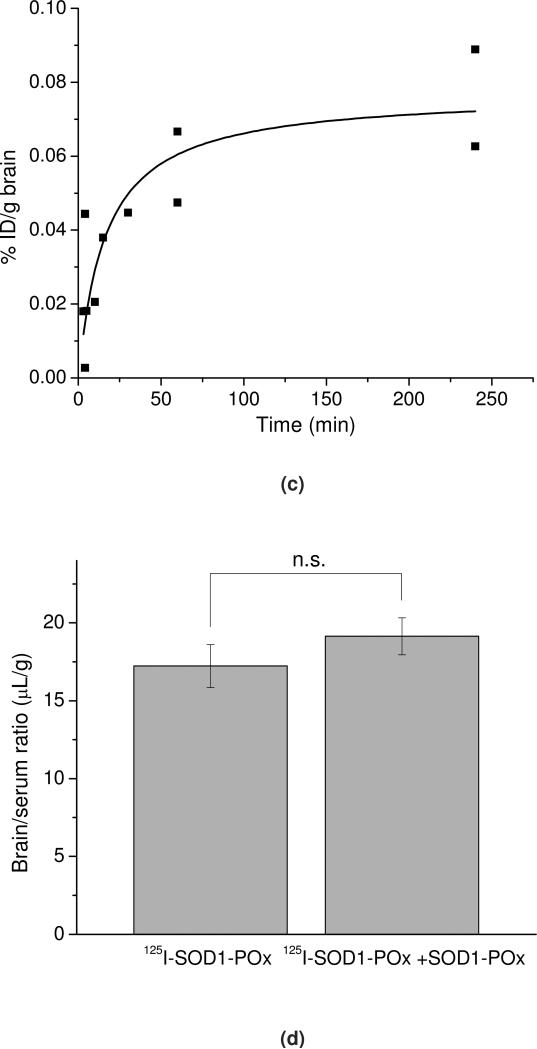
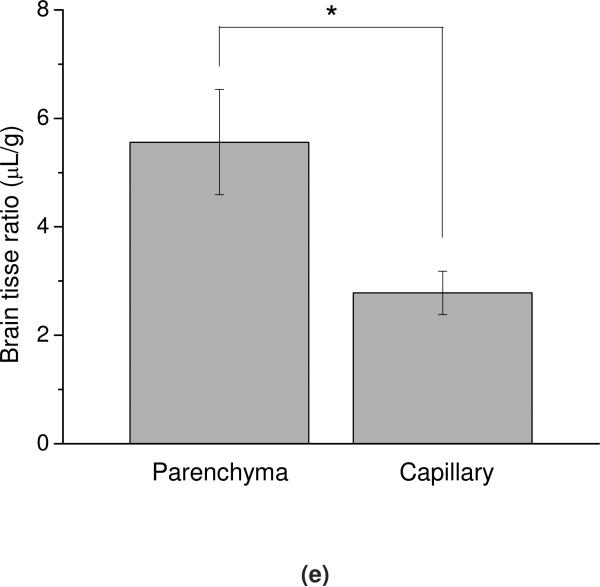
BBB transport and brain uptake of radiolabeled SOD1-(cc)-P(EtOx-b-BuOx) in mice. (a) and (b) Multiple-time regression analysis of (a) 125I-SOD1 and (b) 125I-SOD1-(cc)-P(EtOx-b-BuOx) transport across the BBB. 131I-albumin was co-injected in each group and the brain serum ratio of 131I-albumin was subtracted from that of 125I-SOD1 or 125I-SOD1-(cc)-P(EtOx-b-BuOx) to correct the vascular space of each individual animal. For SOD1-POx, the unidirectional influx rate, Ki = 0.052 ±0.006 μL/g·min; vascular distribution, Vi = 2.121 ±0.05 μL/g (r = 0.86, p <0.0001; n =1 ~2 mice/time point). In comparison, there was no linear relation between the brain/serum ratio of SOD1 and its exposure time, indicating no entry of SOD1 into the brain. (c) Brain uptake of 125I-SOD1-(cc)-P(EtOx-b-BuOx) following i.v. injection. The results were corrected for the distribution volume in the brain of SOD1-POx at t = 0. The maximal value after 4 h following i.v. injection was estimated by a one-site binding model to approach 0.08%ID/g. (d) Nonradioactive SOD1-(cc)-P(EtOx-b-BuOx) (5 μg/mouse) did not inhibit the brain/serum ratio of 125I-(cc)-P(EtOx-b-BuOx) at 60 min after i.v. injection. No statistically significant difference was observed between animals receiving 125I-SOD1-POx and animals receiving 125I-SOD1-POx plus SOD1-POx (n=7).(e) Distribution of 125I-SOD1-(cc)-P(EtOx-b-BuOx) in brain parenchyma and capillary fractions. The vascular space was washed free of blood at 60 min following i.v. injection. The brain parenchyma/serum ratio was significantly higher than the capillary/serum ratio (5.56 ± 0.97 μL/g vs 2.78 ±0.40 μL/g) (* p < 0.05; n =3).


