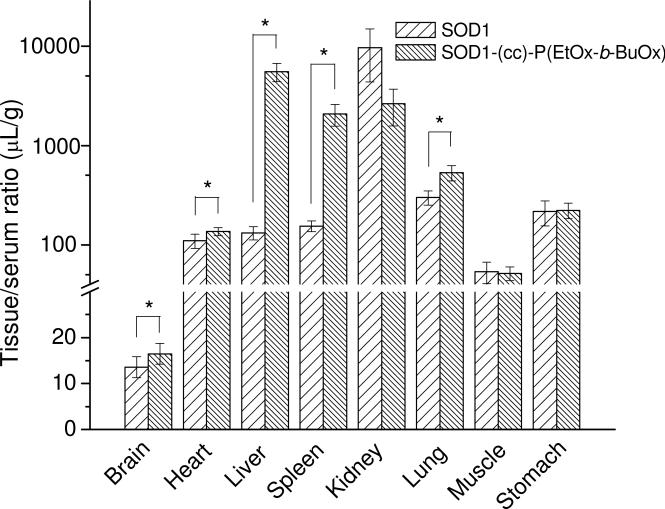
Figure 13.
Tissue distribution of 125I-SOD1-(cc)-P(EtOx-b-BuOx) and co-injected 131I-SOD1 at 60 min following i.v. injection. Results were interpreted as tissue/serum ratio in μL per gram of tissue (n=5). The tissue/serum ratio of SOD1-POx in brain, heart, liver, spleen and lung were all significantly higher than that of SOD1 (* p<0.05), whereas for kidney, muscle, and stomach no significant difference was observed.

