
Figure 1.
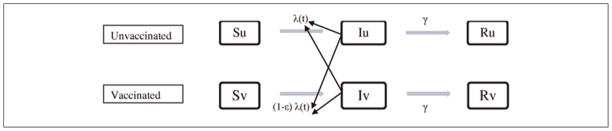
Model of susceptible-infectious-recovered (SIR) disease transmission. λ(t) represents the force of infection, ε represents vaccine efficacy on susceptibility, and γ represents the recovery rate (1/infectious period). Su, Iu, and Ru represent the susceptible, infectious, and recovered population among the unvaccinated, respectively. Sv, Iv, and Rv represent the susceptible, infectious, and recovered population among the vaccinated, respectively.