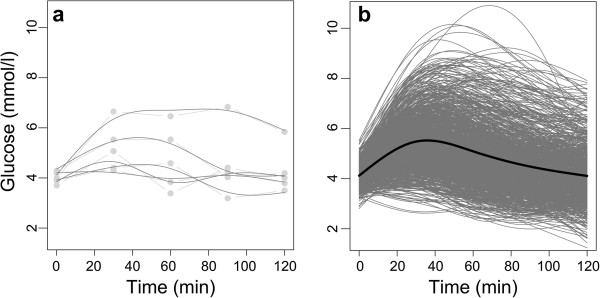
Figure 1.

Observed OGTT data and individually fitted curves at gestational weeks 14–16. a shows the observed OGTT data (light grey) and individually fitted curves (dark grey) for the first five women in the study. The straight lines indicate measurements from the same woman. b shows the 974 individually fitted curves (grey) and the mean of these curves (black).
