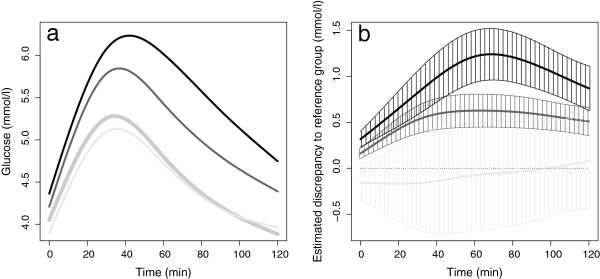
Figure 4.

Results of the FANOVA. a shows the means of the fitted glucose curves for the BMI categories underweight (n=17, light grey curve), normal weight (n=588, bold grey curve), overweight (n=274, dark grey curve) and obese (n=87, black curve). b shows the estimated functional regression coefficients with corresponding CIs (shaded) and with normal weight as the reference category.
