
Figure 3.
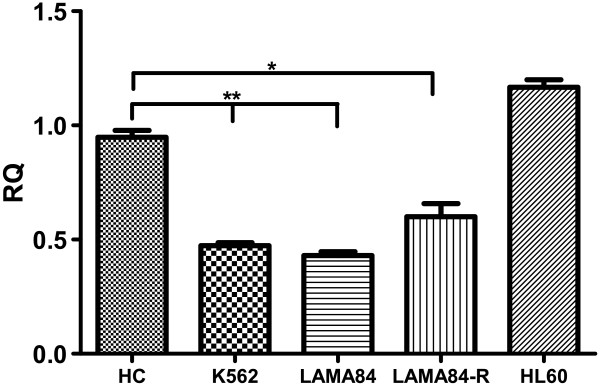
Quantitative real time RT-PCR analysis of SPARC expression in myeloid leukemia cell lines. Bars represent the mean and standard deviation of three independent experiment. SPARC resulted significantly down-regulated in BCR/ABL positive cell lines only. K562 and LAMA84 vs HC: p<0.01; LAMA84-R vs HC: p<0.05.