
Figure 3.
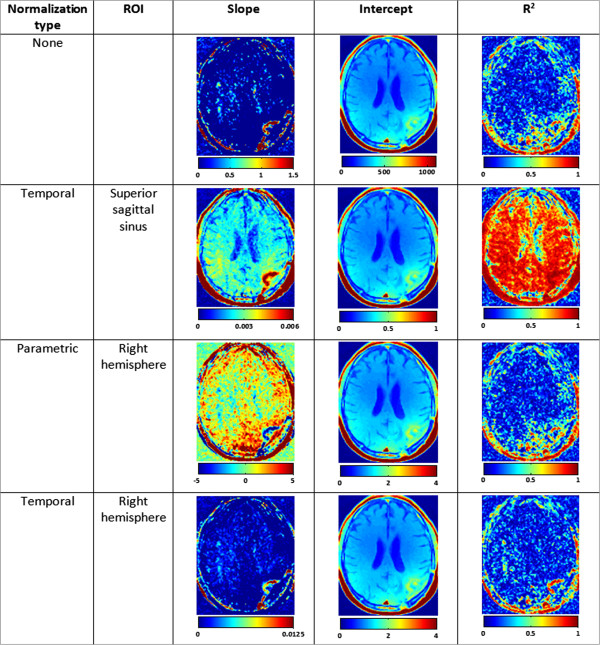
The linear dynamic method. A comparison of normalization methods and effect on the estimated parameters. The slope and intercept are displayed on an arbitrary scale (different scale for each method), whereas the R2 is always scaled in the range of 0–1. The parameters maps are smoothed using a median filter with a kernel of 3x3 voxels for display purpose.