
Figure 5.
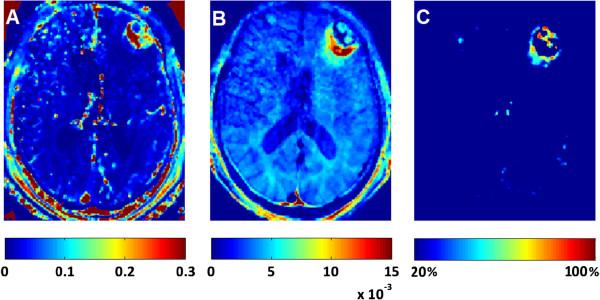
A comparison of the permeability constant Ktrtans,( min-1) from Toft’s model (A), the normalized slope (sec-1) from the linear model (B) and the difference percentage from the post-pre method (C). Quantitative comparison between the 3 methods is not trivial, so a qualitative comparison is shown. False color scales reflect Ktrtans (A), normalized slope (B) and percent difference (C).