Figure 1.

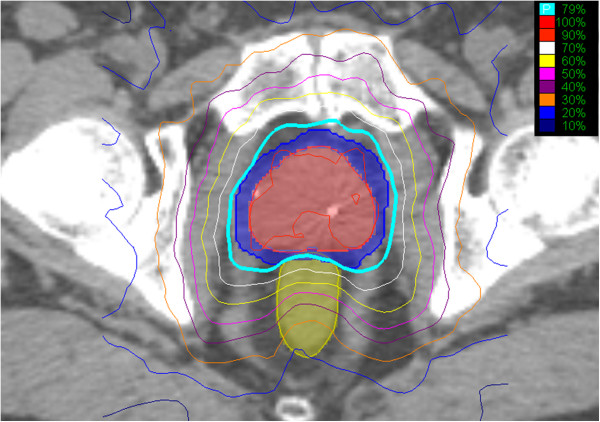
Example treatment plan showing an axial view. The volumes represent the GTV (red), PTV (blue) and rectum (light green). The prescription isodose line (79%) is denoted by the thick light blue line.

Example treatment plan showing an axial view. The volumes represent the GTV (red), PTV (blue) and rectum (light green). The prescription isodose line (79%) is denoted by the thick light blue line.