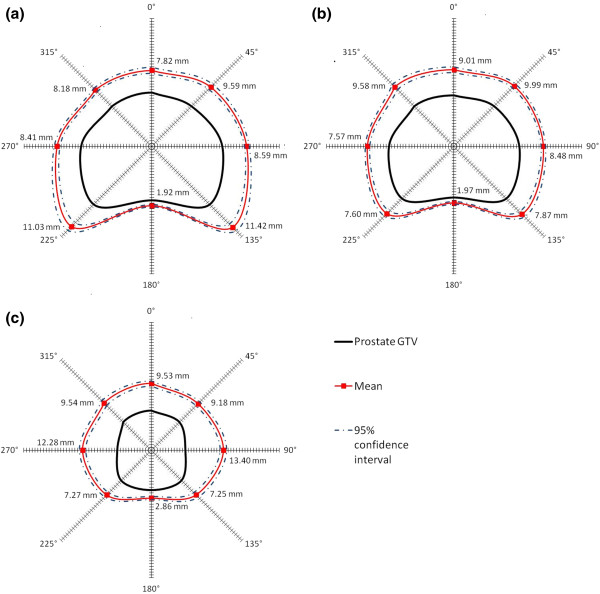
Figure 2.
Coverage of potential ECE. Radar plots of the mean distance (solid red line) in millimeters of the 33 Gy isodose line from an idealized prostate GTV (solid black line). The 95% confidence interval of the mean is shown in dashed blue lines. The distances are shown on (a) the axial plane 1 cm caudal to base, (b) the axial plane in mid-prostate, and (c) the axial plane 0.5 cm cranial to apex.

