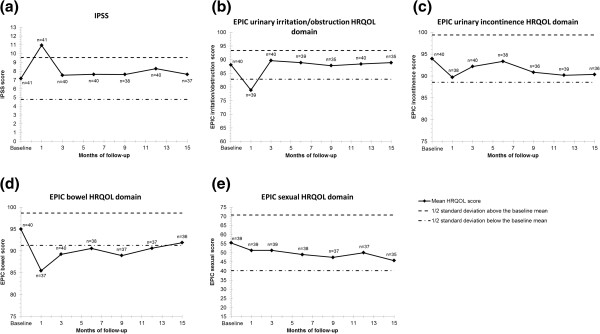
Figure 3.

(a-e) Mean quality of life measures at baseline and follow-up. Analysis of the QOL data included all time points that had at least an 80% patient response rate, which was up to 15 months for all QOL measures. Shown are plots for IPSS (a), EPIC urinary irritation/obstruction domain (b), EPIC urinary incontinence domain (c), EPIC bowel domain (d), and EPIC sexual domain (e). The thresholds for clinically significant changes in scores (½ standard deviation above and below the baseline) are marked with dashed lines. IPSS scores range from 0–35 with higher values representing worsening urinary symptoms. EPIC scores range from 0–100 with higher values representing a more favorable health-related QOL.
