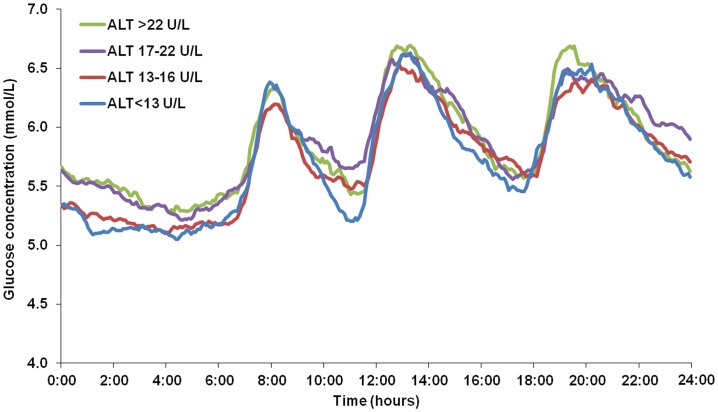
Figure 1. Continuous glucose profiles representing mean data from 24 hours of monitoring.
The figure shows that among four subgroups according to the quartile distribution of ALT values (<13 IU/L, 13–16 IU/L, 17–22 IU/L, >22 IU/L), subjects with ALT between 17–22 IU/L and ALT >22 IU/L had higher nocturnal MBG level than the other two groups (P<0.05).

