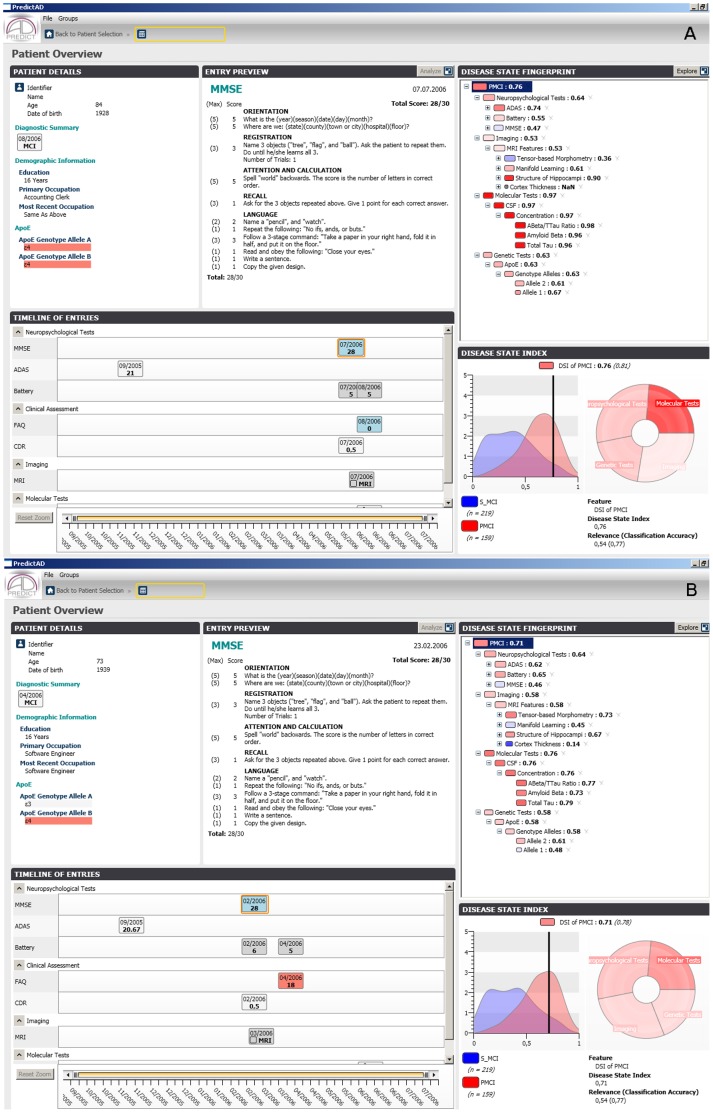
Figure 1. Screenshots from the PredictAD tool for two cases.
The cases A and B had similar baseline neuropsychological tests, biomakers, and genetic tests, but the case A did not convert to AD, case B converted to AD during 3-year follow-up period. The case A was classified by both predictAD tool and current guildline for prodromal AD. It is probable that this case will convert in longer follow-up. The MCI subjects like case A seem to be a potential interesting study group. It might be possible to identify sensitive biomarkers to detect AD at early phase or explore novel preventative factors to delay the onset of symptoms of AD by investigating this subgroup. The main window of the PredictAD tool consists of five panels. The ‘Patient details’ panel shows basic information about the patient. The ‘Timeline of entries’ panel contains information about all measurements acquired from patient. The panel is interactive: the user can click any of the entries visible and a summary isshown in the ‘Entry preview’ panel. The disease state fingerprint is shown in the ‘Disease state fingerprint’ panel. When the user selects any of the item from the fingerprint, details behind the item are shown in the ‘Disease state index’ panel. The distributions show the probability density functions of the corresponding item for the study and control groups, in this case PMCI and SMCI groups, and the value measured from the patient is shown by a vertical black line.

