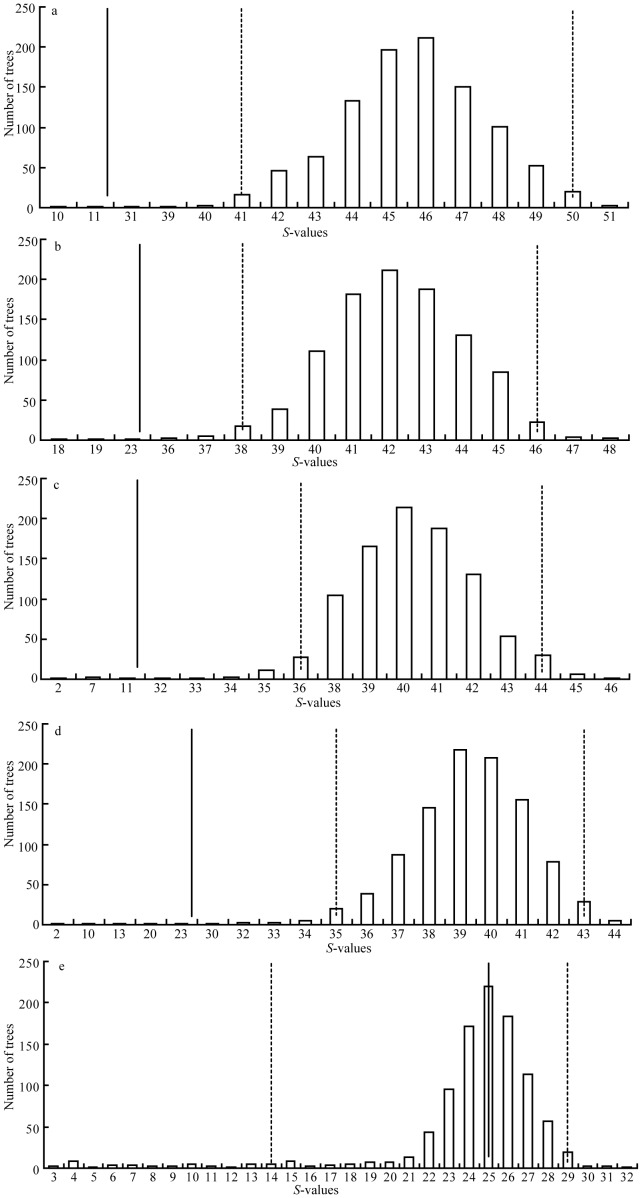
Figure 6. S-values for 1000 simulated coalescent genealogies.
(a) Results from simulations within the single refugium hypothesis; (b) Results from simulations within the two refugia hypothesis; (c) Results from simulations within the three refugia hypothesis; (d) Results from simulations within the hypothesis of four refugia at the end of the Last Glacial Maximum; (e) Results from simulations within the hypothesis of four refugia before the Last Glacial Maximum. The black line represents the S-value for BI genealogy and dashed lines represent the 95% credible interval for the distribution.

