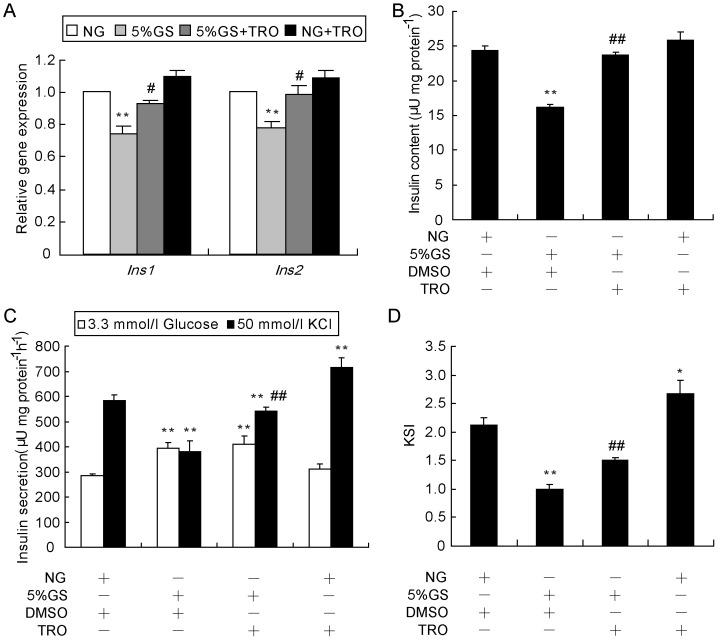
Figure 6. Activation of PPARγ rescues insulin gene expression and insulin secretion.
(A) Cells were pre-treated with TRO or DMSO for 1 h, followed by treatment with NG or 5% GS for 8 h, and then total RNA was extracted using Trizol reagent. Real-time RT-PCR was utilized to determine mRNA levels of Ins1 and Ins2. β-Actin was used as an internal standard. **P<0.01 vs. NG; # P<0.05 or # # P<0.01 vs. 5% GS. INS-1 cells were treated with NG or 5% GS with or without 20 µmol/l TRO for 24 h. Thereafter, the KSIS assay (C) was carried out, and the potassium-stimulated insulin secretion index (KSI) (D) and total insulin in the extract (B) were determined. The insulin level was determined by RIA. Insulin secretion and content were normalized by total protein concentration. *P<0.05 and **P<0.01 vs. NG + DMSO; # # P<0.01 vs. 5% GS + DMSO.

