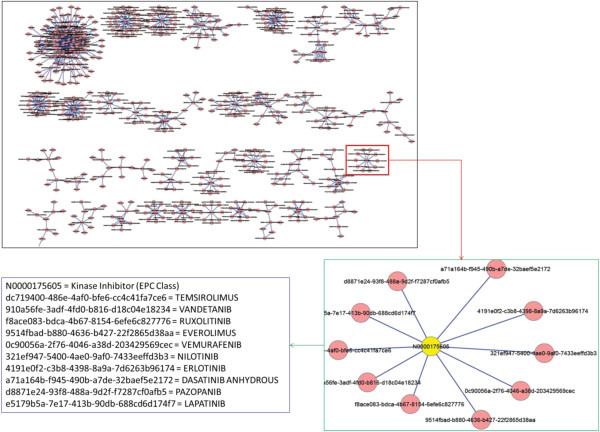
Figure 8.
Network visualization of a drug and drug class network based on the profiling results of SPL drug labels (The upper left is the subsets of entire drug network built using the results from this study; the lower right is an enlarged subset of the network; the lower left illustrates the details about the sub-network shown in lower right).

