
Figure 13.
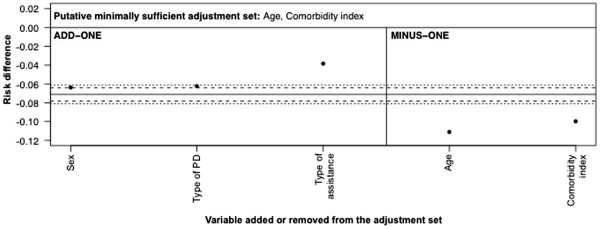
Add-one and minus-one patterns for a adjustment-variable set of{Age, Comorbidity index}based on DAG in Figure9 The solid horizontal line is the RD estimate adjusted on this set. The dotted horizontal lines are the pre-defined meaningful change thresholds for an absolute change of ± 0.01 in the RD. The dashed horizontal lines are a relative change of ±10% of the starting RD. The add-one section shows the RD upon adding each variable listed to the adjustment-variable set in turn. The minus-one section shows the RD upon removing each variable listed from the adjustment-variable set in turn.