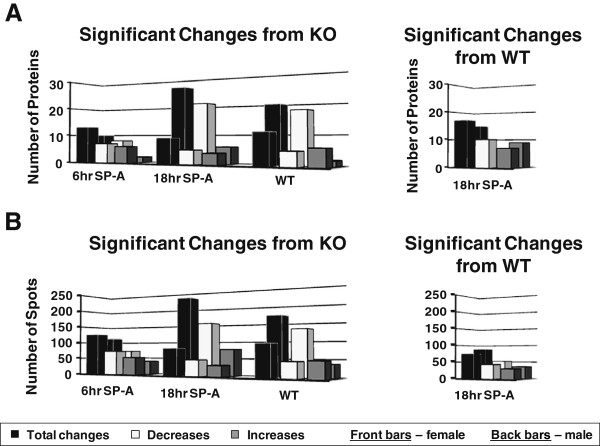
Figure 2.
Summary of significant changes in whole proteins and gel spots. In Panel A the graphs depict the number of significant changes in identified proteins (from a total of 76) compared to KO in macrophages from female mice. The black bar represents the total significant changes, the white bars represent significant decreases relative to KO, and the gray bars represent significant increases relative to KO. The histograms on the right depict significant changes between WT and 18 hr SP-A treated mice. Bars in the front are the values from females (present study) and bars in the back are values from males that we have previously published [29] and are shown here for comparison purposes. In Panel B similar comparisons are shown for the gel spots.

