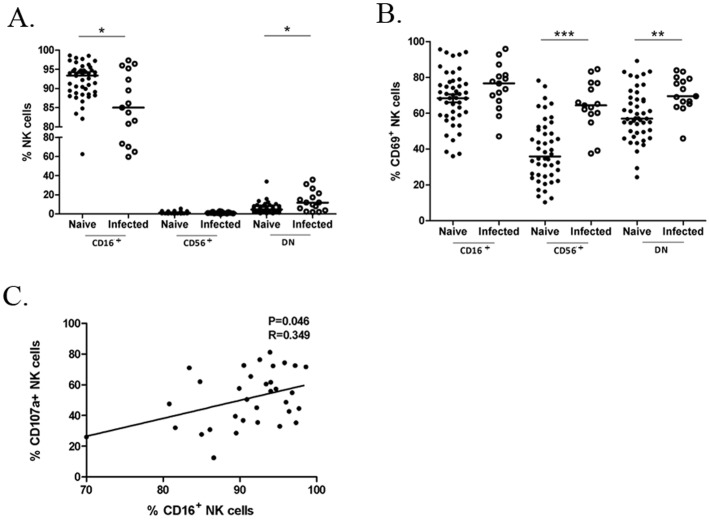
Figure 2. Phenotypic differences of NK-cell subsets in the naive and SIV/SHIV infected macaques.
(A) CD16 (FcγRIII) expression is strongly downregulated in the chronically infected group. Horizontal bars indicate medians for the non-normality data analyzed by Mann-Whitney U-test; *P<.05. (B) Expression of CD69 increases in the infected group compared with the naive. Horizontal bars indicate means for the normality data analyzed by Student's t-test; **P<.01;***P<.001. (C) Correlation between the expression of CD16 and production of CD107a in NK cell-mediated ADCC is illustrated. Spearman Rank Order Correlation coefficients ‘R’ and corresponding ‘P values’ are indicated.

