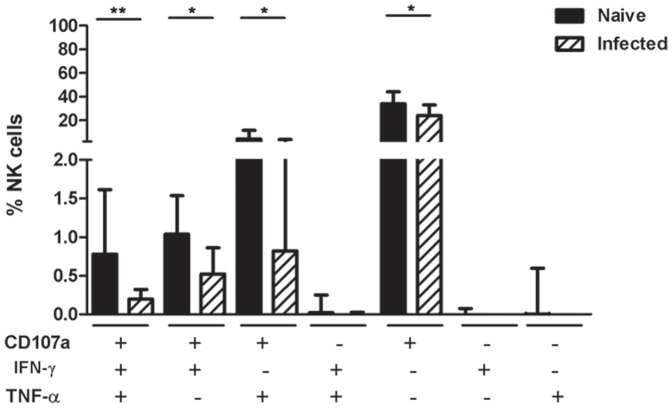
Figure 3. Functional profile of NK cells in naive and SIV/SHIV infected macaques.
Total NK cells were divided into 7 subpopulations based on their production of CD107a, IFN-γ and TNF-α individually or in combination. The proportions of NK cells producing a given function were highly disparate between the 22 naive and 27 infected macaques, which are shown with medians and interquartile ranges in the graph. Mann-Whitney U-test; *P<.05;**P<.01.

