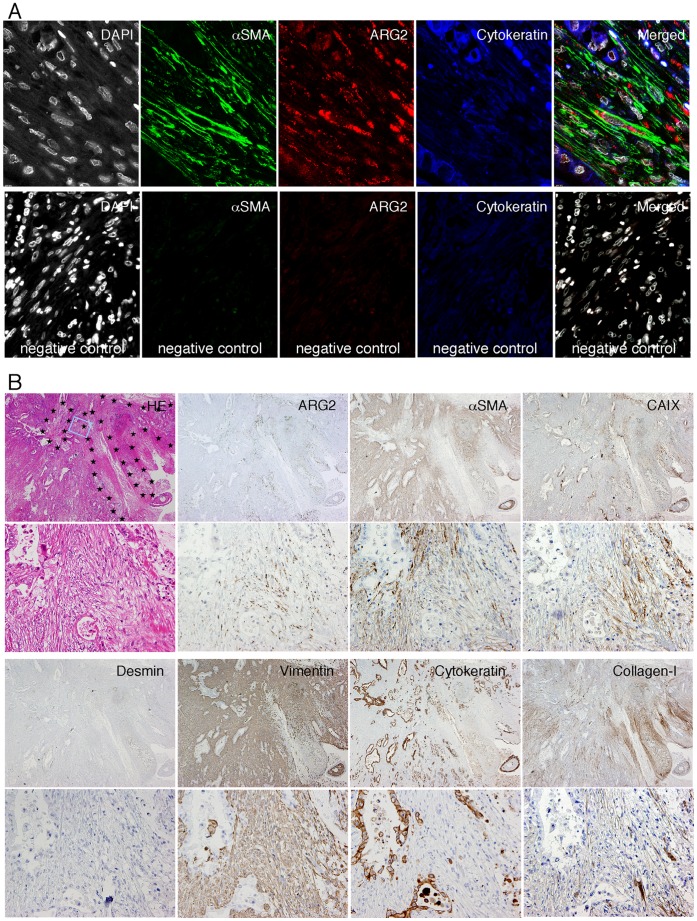
Figure 3. ARG2 was expressed mostly in CAFs within and around necrotic areas in PDC tissue.
(A) Triple immunofluorescence shows that most of the dot-like staining of ARG2 (red) is present in α-SMA-positive fibroblasts (green). Cancer cells are positive for cytokeratins (blue). Nuclei are stained by DAPI (white). (B) Histology and immunohistochemistry of PDC tissue in low- (upper-photo of each pair of photos) and high-power view (lower-photo of each pair of photos). HE staining and immunohistochemistry for several antigens in serial tissue sections. Necrotic areas are surrounded by star marks in the low-power HE photo and the rectangle (light blue) corresponds to the area of the high-power view.

