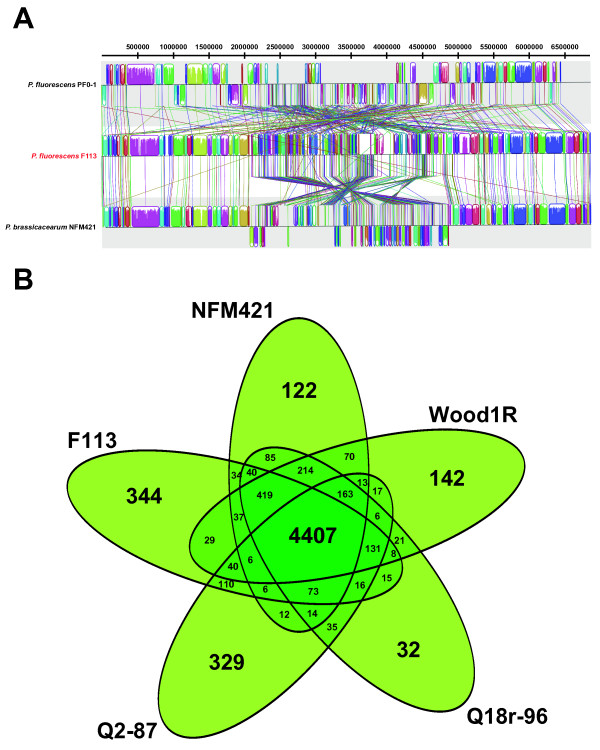
Figure 2.
Comparison of P. fluorescens F113 genome and CDSs against other pseudomonads sequences and ORFomes. (A) Genome to genome alignment of P. fluorescens F113, P. fluorescens Pf0-1 and P. brassicacearum NFM421, using Mauve software with a window of 1000 nucleotides and F113 as the reference genome. Boxes with same colour indicate syntenic regions. Boxes below the horizontal strain line indicate inverted regions. Rearrangements are shown by coloured lines. Scale is in nucleotides. (B) Venn diagram showing the number of clusters of orthologous CDSs shared and unique between strains clustered in Subgroup I: P. fluorescens F113, WoodR1, Q2-87, and P. brassicacearum NFM421 and Q8r1-96.

