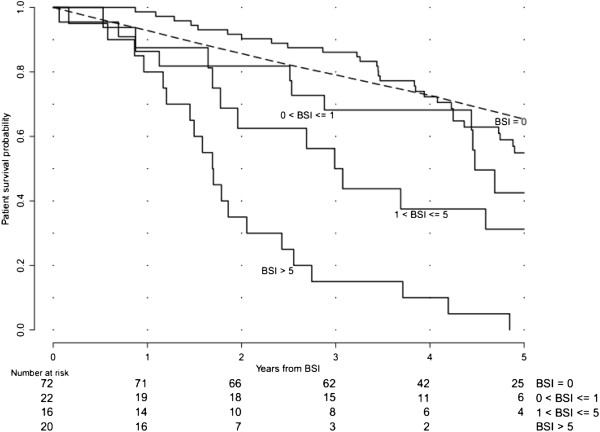
Figure 2.
Kaplan-Meier curves showing patient-survival probability stratified by BSI categories. The difference between the four groups of patients without metastases (M0) and with metastases BSI < 1, BSI = 1 to 5 and BSI > 5 was statistically significant (p < 0.001). The broken line shows an age-matched control survival curve for the M0 group.

