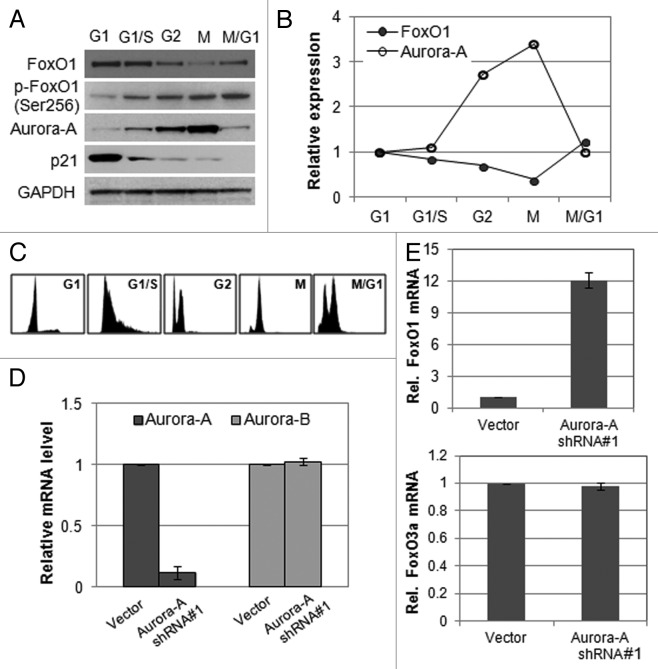
Figure 1. Expression of FoxO1 and Aurora A kinase is inversely related. (A) Western blot analysis of total FoxO1, phospho-FoxO1 (S256), p21 and Aurora A expression at different cell cycle stages in HepG2 cells. Equal loading of protein was confirmed by GAPDH. (B) Quantitative real-time PCR of FoxO1 and Aurora A expression at different cell cycle stages of HepG2 cells. RNA levels were normalized to GAPDH. (C) Cell cycle phases of HepG2 cells were confirmed by FACA analysis. (D) Knockdown of Aurora A was confirmed by quantitative real-time RT-PCR. The graph represents means ± SD for the change in the mRNA level relative to GAPDH from three independent experiments. (E) Expression of FoxO1 and FoxO3a in Aurora A-knockdown cells was measured by quantitative real-time RT-PCR. GAPDH expression was examined as an internal control. Data represent the means ± SD of three independent experiments.

An official website of the United States government
Here's how you know
Official websites use .gov
A
.gov website belongs to an official
government organization in the United States.
Secure .gov websites use HTTPS
A lock (
) or https:// means you've safely
connected to the .gov website. Share sensitive
information only on official, secure websites.
