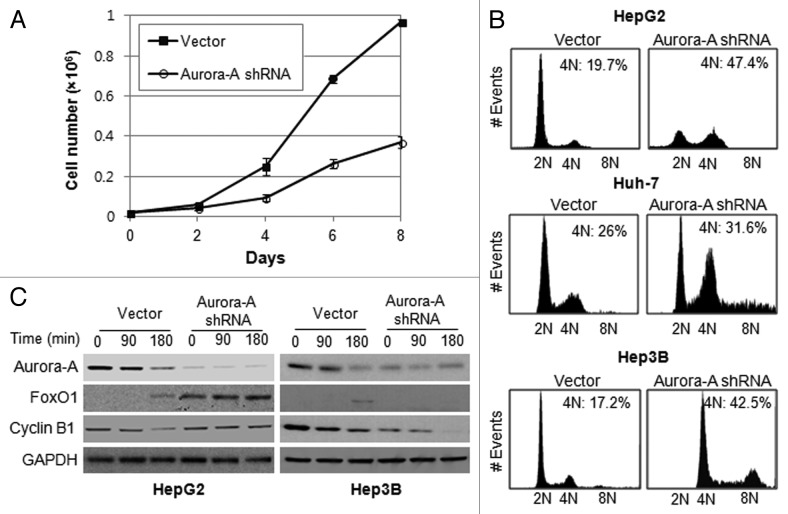
Figure 3. Silencing of Aurora A induces G2/M arrest. (A) The growth of vector and Aurora A shRNA HepG2 cells were measured on the indicated days. Data shown are the mean ± SD of three independent experiments. (B) Cell cycle profile of synchronized vector control and Aurora A shRNA HepG1, Huh-7 and Hep3B cells was analyzed by flow cytometry analysis. Percent of G2/M cells is shown. (C) The level of FoxO1, cyclin B1 and Aurora A during M phase was measured by western blot analysis. Nocodazole (100 ng/ml) arrested control and Aurora A shRNA HepG2 and Hep3B cells were released from nocodazole block, and protein lysates were prepared at the indicated time thereafter. Equal loading of protein was confirmed by GAPDH.

An official website of the United States government
Here's how you know
Official websites use .gov
A
.gov website belongs to an official
government organization in the United States.
Secure .gov websites use HTTPS
A lock (
) or https:// means you've safely
connected to the .gov website. Share sensitive
information only on official, secure websites.
