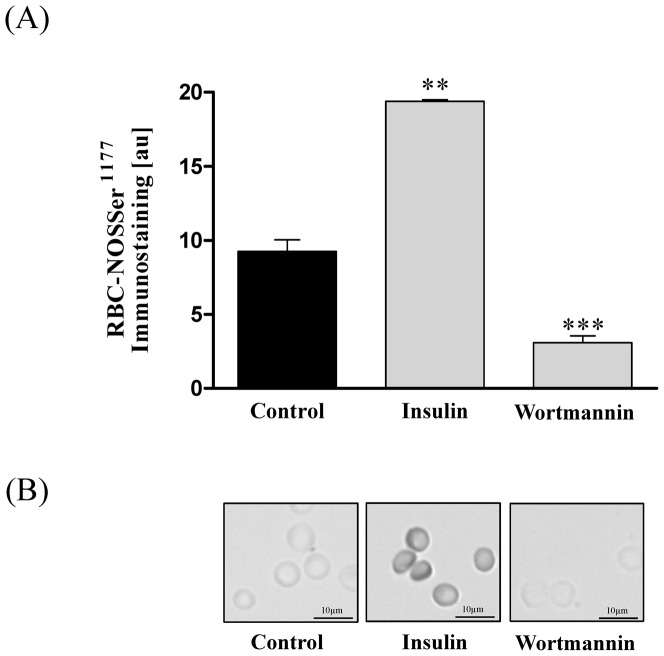
Figure 1. Changes of RBC-NOSSer1177 levels after RBC incubation with RBC-NOS stimulants, inhibitors and NO controls.
(A) Bars show statistical analysis of gray values [au] after a 60 min incubation of RBCs with insulin and wortmannin, respectively. Application of RBC-NOS stimulant insulin led to a significant increase in enzyme phosphorylation compared to control (P<0.01). Wortmannin (P<0.001) application decreased phosphorylation, respectively. (B) Pictures show representative RBC-NOSSer1177 staining after 60 min incubation, respectively. Magnification for all images was 400-fold. Data in (A) are presented as mean±S.E.M., n = 6.

