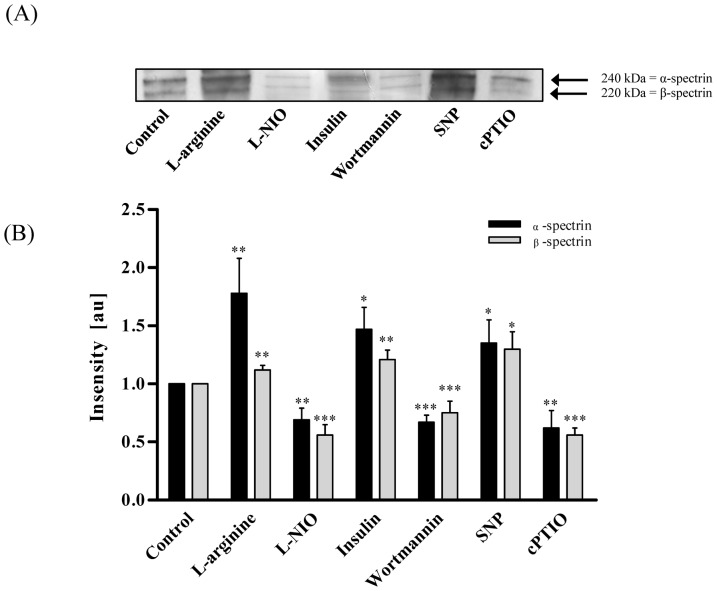
Figure 3. S-nitrosylation of RBC proteins after modification of RBC-NOS-dependent NO production.
(A) Representative western blot bands after 60 min incubation of RBCs with RBC-NOS stimulants, inhibitors and NO controls are demonstrated. The image shows two distinctive bands with varying intensity depending on RBC-NOS modulation. LC-MS/MS analysis identified 240 kDa band as possible α- spectrin and 220 kDa band as possible β-spectrin. (B) Calculation of relative intensity in relation to the control sample revealed that S-nitrosylation of both, α- and β-spectrin, significantly increased upon L-arginine, insulin and SNP incubation and significantly decreased upon L-NIO, wortmannin and cPTIO incubation, respectively. Data in (B) are presented as mean±S.E.M., n = 6.

