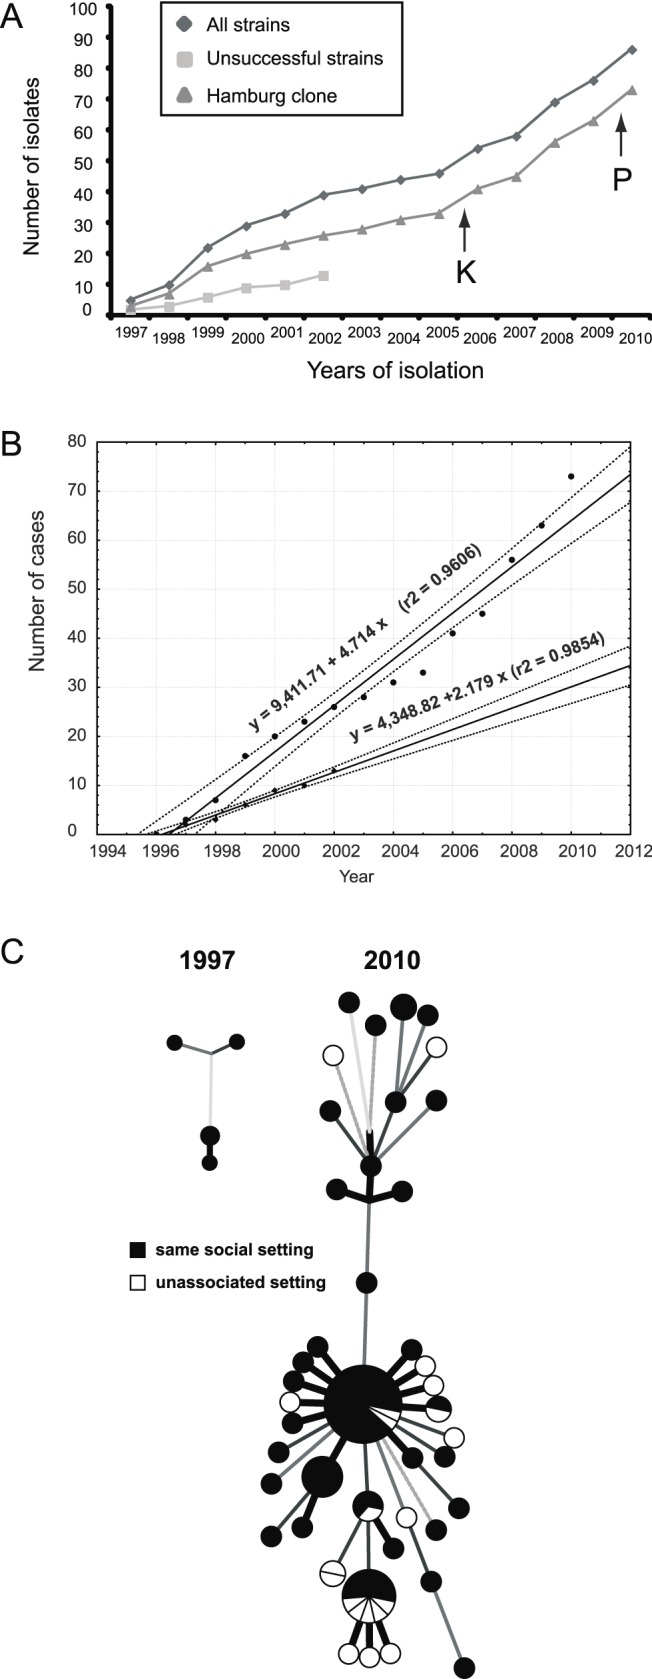
Figure 3. Spread of the Mtb outbreak in Hamburg and Schleswig-Holstein.

(A) Members of this outbreak have been continuously isolated over the past 14 y. Isolates of the two distinguishable parts, the “Hamburg clone” and the remaining unsuccessful strains, are shown. Black arrows indicate the first isolations of strains at different sites in Schleswig-Holstein in 2006 (Kiel [K]) and 2010 (Pinneberg [P]). (B) Time course of the Mtb cases and their least-squares regressions. Upper and bottom plots correspond to the Hamburg clone and unsuccessful strains, as shown in (A). Solid and dotted lines represent calculated regression lines and 95% confidence interval boundaries, respectively. Note that both the Hamburg clone and the unrelated strains did not significantly depart from linear growth on this temporal scale, implying that selection coefficients during the epidemic were fairly constant. (C) Explored environmental settings were mapped on the minimum spanning trees shown in Figure 1.
