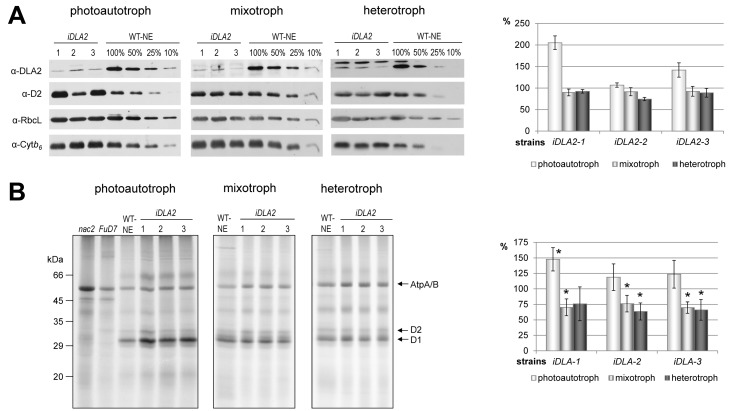
Figure 7. D1 accumulation and synthesis in iDLA2 lines under different growth conditions.
(A) D1 protein accumulation. Immunoblot analysis of 40 µg of total cell proteins from indicated iDLA2 lines along with a dilution series of the control strain transformed with the empty vector (WT-NE). Cells were cultured photoautotrophically, mixotrophically, or heterotrophically. Protein gel blot analyses were performed using antibodies raised against the proteins indicated at the left (RbcL, large subunit of Rubisco; Cytb6, cytochrome b6; D2, reaction center protein of PSII). Right panel demonstrates the quantification of immunoblot signals of three independent experiments. Quantification was performed using the AlphaEaseFC software (Alpha Innotech Corp.) by calculating the ratio of D2 over Cytb6. Values obtained for WT-NE were set to 100%. Mean values and standard deviations from three independent experiments are shown. (B) D1 protein synthesis. Membrane proteins of depicted strains were pulse-labeled with 35S sulphate, fractionated in SDS-urea-gels, and analyzed by autoradiography. (Right panel) Quantification of signals was performed by using AlphaEaseFC software (Alpha Innotech Corp.) and calculating the ratio of D1 over AtpA/B. Values obtained for WT-NE were set to 100%. Growth conditions as indicated. Mean values and standard deviations from three (photoautotrophic) or five (mixotrophic/heterotrophic) independent experiments are shown. An asterisk indicates that a mean D1/AtpA/B labeling ratio is significantly different from that of WT-NE (100%) as determined by a one-sample t test (p<0.05).

