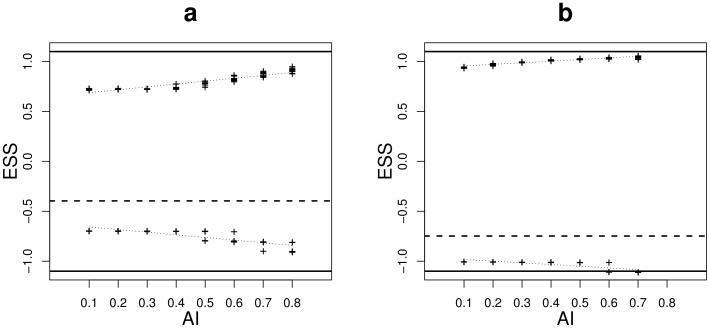
Figure 7. Specialist trait values at the equilibrium (ESS) plotted against the aggregation level of habitat  (
( ) for situation A (a) and situation B (b).
The relationship between ESS values and  was tested by linear regression (dotted line). Dashed line, singular strategy; solid lines, habitat optima. Other parameters are for a:
  ,
,  (
( and
and  ) and
) and  ; for b:
  ,
,  (
( and
and  ) and
) and  . The lattice environment was used.

