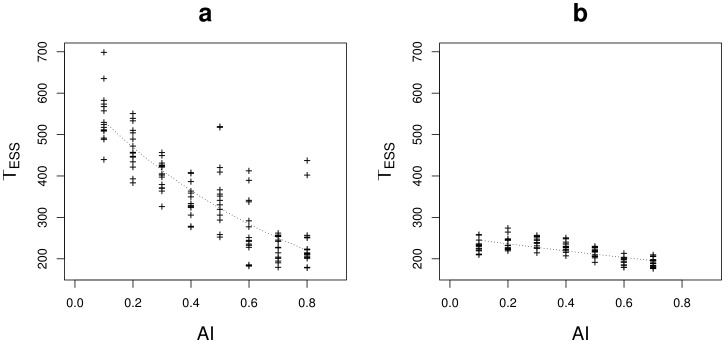
Figure 8. Time to reach the ESSs ( ) plotted against the aggregation level of habitat
  (
( ) for situation A (a) and situation B (b).
The relationship between  and
and  was tested by a GLM with Poisson distributed errors (dotted line). Other parameters are for a:
  ,
,  (
( and
and  ) and
) and  ; for b:
  ,
,  (
( and
and  ) and
) and  . The lattice environment was used.

