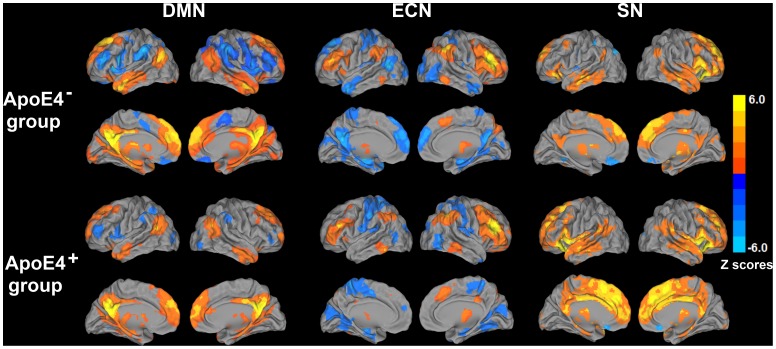
Figure 1. Functional connectivity pattern of the default mode network (DMN), executive control network (ECN), and salience network (SN) in APOE-ε4 carriers (ApoE4+) and nonAPOE-ε4 carriers (ApoE4−).
Results are projected on a surface template (Caret software; Van Essen, 2005). Bright color indicates positive connectivity and the blue color indicates negative connectivity in ApoEε4− and ApoEε4+ groups. Color bar is presented with z scores.

