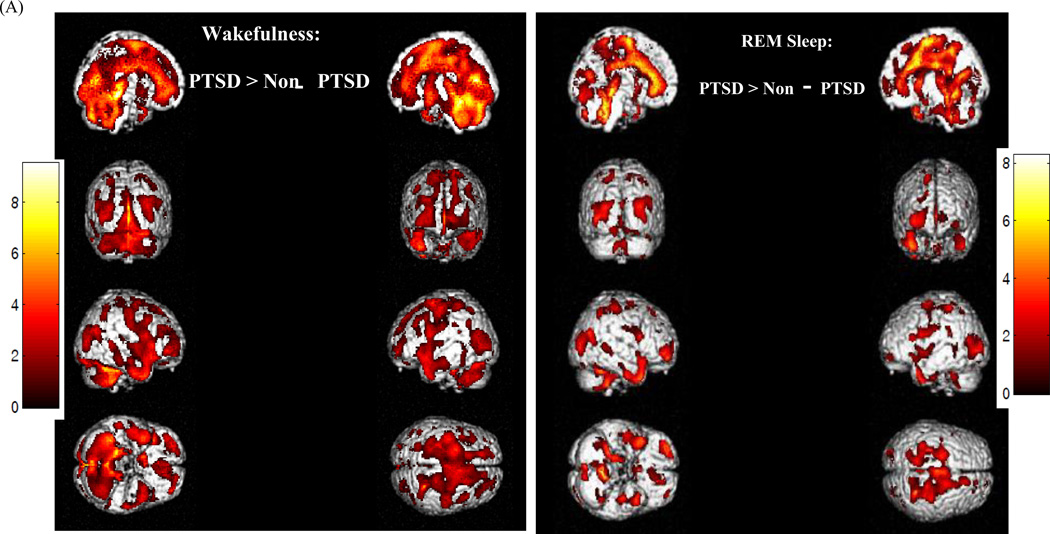
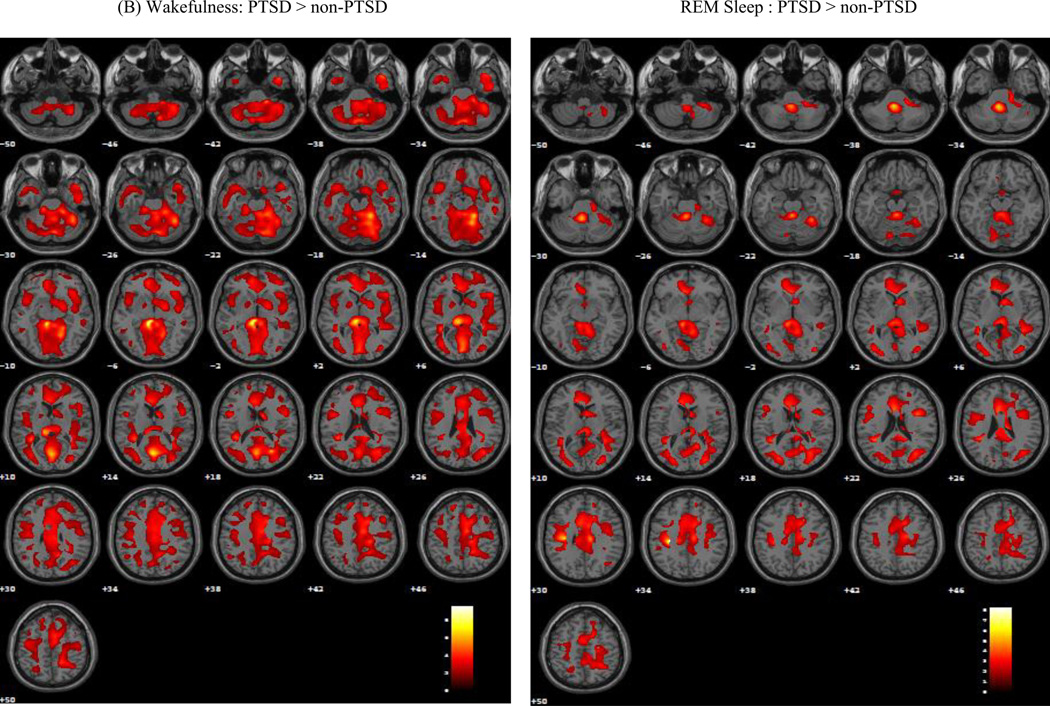
Figure 1.
Render images (A) and axial planes (B) depicting brain regions where veterans with PTSD show greater relative rCMRglc than control veterans without PTSD (CTL) during wakefulness (WAKE) and rapid-eye movement (REM) sleep. Statistical maxima were identified in MNI (x, y, z) coordinates. The alpha level for significance was set at 0.05, with family-wise error (FWE) correction for multiple comparisons.


