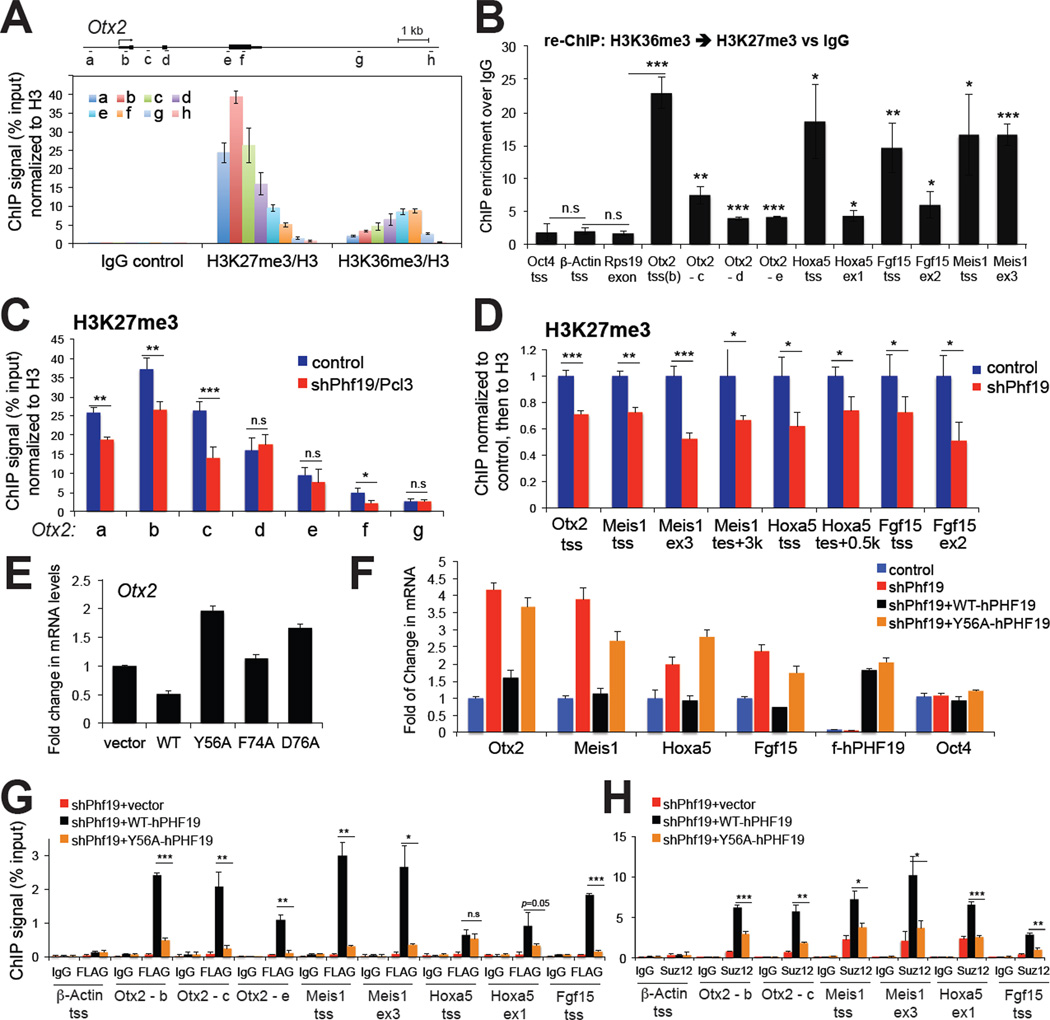
Figure 5. Phf19/Pcl3 demonstrates a Tudor-dependent repression of differentiation-associated genes.
(A) ChIP for H3K36me3 and H3K27me3 across the Otx2 gene in F9 embryonic carcinoma cells. The diagram on top depicts the genomic organization of Otx2, with positions of each ChIP PCR amplicon marked as a to h (not drawn to scale). Data of ChIP signals (y axis) from three independent experiments were normalized to 1% of input and to histone H3, and presented as mean ± SD. See also Figure S5.
(B) Sequential re-ChIP showing fold of enrichment by comparing ChIP signals of H3K27me3 over IgG control in a sequential IP following the first IP using H3K36me3 antibodies. Signal of ChIP (y axis) from three independent experiments were normalized to those of 1% of input and then to nonspecific IgG control, and presented as mean ± SD. Statistics shown are t-test comparisons of each tested loci to three negative control loci, the transcriptional starting site (tss) of Oct4 and β-Actin, and gene body of Rps19. *, p<0.05; **, p<0.01, ***, p<0.005; n.s., not significant.
(C–D) ChIP examining H3K27me3 levels associated with Otx2 (panel C) and other examined development genes (panel D) in F9 cells transduced with control or Phf19-specific hairpins. Data of ChIP signals (y axis) from three independent experiments were normalized to 1% of input and to histone H3, and presented as mean ± SD. ex, exon; tes, transcriptional ending site.
(E) Real-time PCR detecting Otx2 expression levels in F9 cells following overexpression of wild-type (WT) and Tudor mutant forms of PHF19/PCL3. Data of relative mRNA levels (y axis) from three independent experiments were normalized to vector transduced cells and presented as mean ± SD.
(F) Real-time PCR of Otx2, Meis1, Hoxa5, Fgf15 and Oct4 expression in F9 cells following Phf19 knockdown (sh_Phf19) and re-introduction of hairpin-resistant wild-type (WT) and Tudor mutant forms of FLAG-tagged human PHF19/PCL3 (F-PHF19). Y-axis represents fold change after normalization of data from three independent experiments to control cells (presented as mean ± SD). See also Table S3.
(G–H) ChIP examining the residence of FLAG-tagged PHF19/PCL3 (panel G) and SUZ12 (panel H) at Otx2, Meis1, Hoxa5 and Fgf15 genes after transduction of hairpin-resistant wildtype or Tudor mutant PHF19/PCL3 into knockdown cells. Signal of ChIP (y axis) from three independent experiments were normalized to those of 1% of input and presented as mean ± SD. IgG and tss of β-Actin were used as antibody and locus control, respectively. Statistics shown are t-test comparisons of ChIP in cells transduced with wild-type PHF19 to that with Tudor mutant forms. *, p<0.01; **, p<0.001, ***, p<0.0001.

