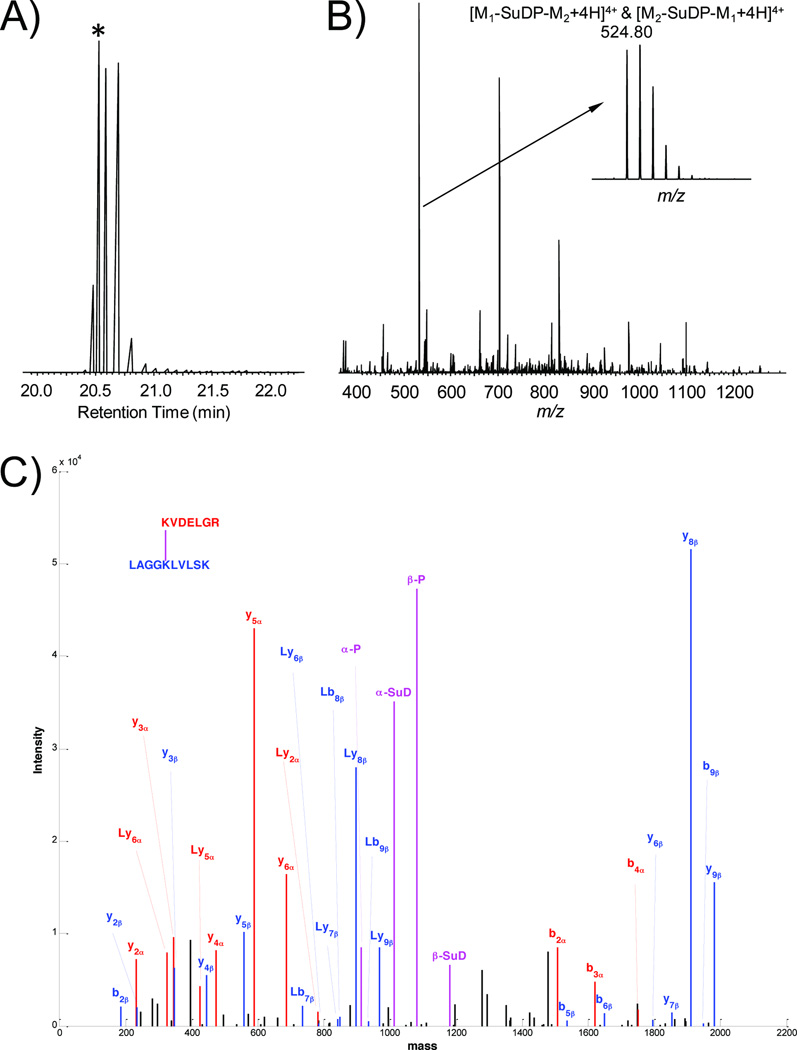
Figure 2.
LC/MSn analysis of an AbrB inter-peptide crosslink KVDELGR-LAGGKLVLSK. (A) The extracted chromatograph of the crosslink precursor m/z 524.80. The each peak maximum corresponds to the MS scan with the intervening time between them corresponding to the tandem MS scans. (B) The MS spectrum containing the crosslink precursor. The time point of the selected MS spectrum is indicated by the asterisk in panel (A). In this example, the crosslinked precursor is the most abundant ion in the spectrum, which is enlarged to illustrate its isotopic distribution. It is a +4 charged ion with a monoisotopic m/z value of 524.80, where M1 is KVDELGR (Peptide 1) and M2 is LAGGKLVLSK (Peptide 2) as listed in Table 1. (C) The MS2 product ion spectrum of crosslink precursor. The product ion spectrum is reconstructed based on the deconvoluted neutral monoisotopic masses generated by CXLinkS using the raw data and is manually inspected to verify the crosslink identification. The product ions from peptide alpha KVDELGR (M1), peptide beta LAGGKLVLSK and the crosslinker fragmentation are shown in red, blue and magenta, respectively. The letter L indicates the remaining portion of the cleaved crosslinker with respect to each peptide fragment ion. Each individual linked peptide (magenta) is subjected to LC/MS3 CID fragmentation for sequence identification (MS3 data not shown).

