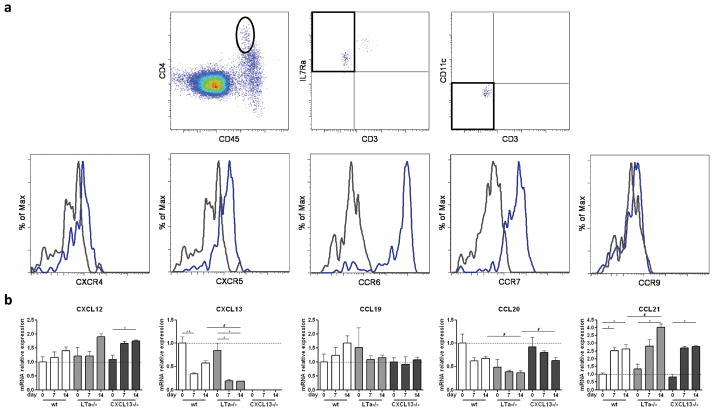
Figure 4. Chemokine receptor expression on colonic LTi cells and colonic chemokine expression.
a Chemokine receptor expression on CD45intCD4+IL7Rα+CD3−CD11c− cells LTi cells was assessed by flow cytometry. Grey histograms represent FMO controls in which the primary antibody was omitted, while blue histograms represent the actual staining. At least 8 colons were used per analysis and a representative FACS experiment is shown. The experiment was performed 3 times. b Chemokine mRNA expression in whole colons of wild-type, LTα−/− and CXCL13−/− mice of different ages was assessed by real-time PCR. 4–7 colons were analyzed per group. The expression of each transcript in each sample was normalized to the expression of the transcripts for the housekeeping genes Cyclophilin and Ubiquitin. The mean expression levels of each transcript for sample wild-type day 0 were arbitrarily set at 1. Data were compared with one way non-parametric ANOVA and Dunn’s multiple comparison tests. Mean ± SEM is shown. * p<0.05, ** p<0.01 between different age groups within the same mouse genotype; # p<0.05 between different mouse genotypes within the same age group.

